Visualizing Workflows
Workflows are a procedure, made up of different stages, which turn input to a desired output. Sometimes, the workers in one stage depend on the output from a prior stage. When one worker depends on another's output, it is called a dependency. Consider all the dependency relationships for all the workers in workflow — we can visualize that dependency structure for the workflow as a network (graph).
Visualizing a workflow
A group of workers that do not depend on each other's output can work at the same time, in parallel. Parallel work splits the dependency graph into multiple branches. In a later stage, those branches will be brought back together by other workers. Some parts of a workflow might involve parallel workers, while other steps might involve a single worker.
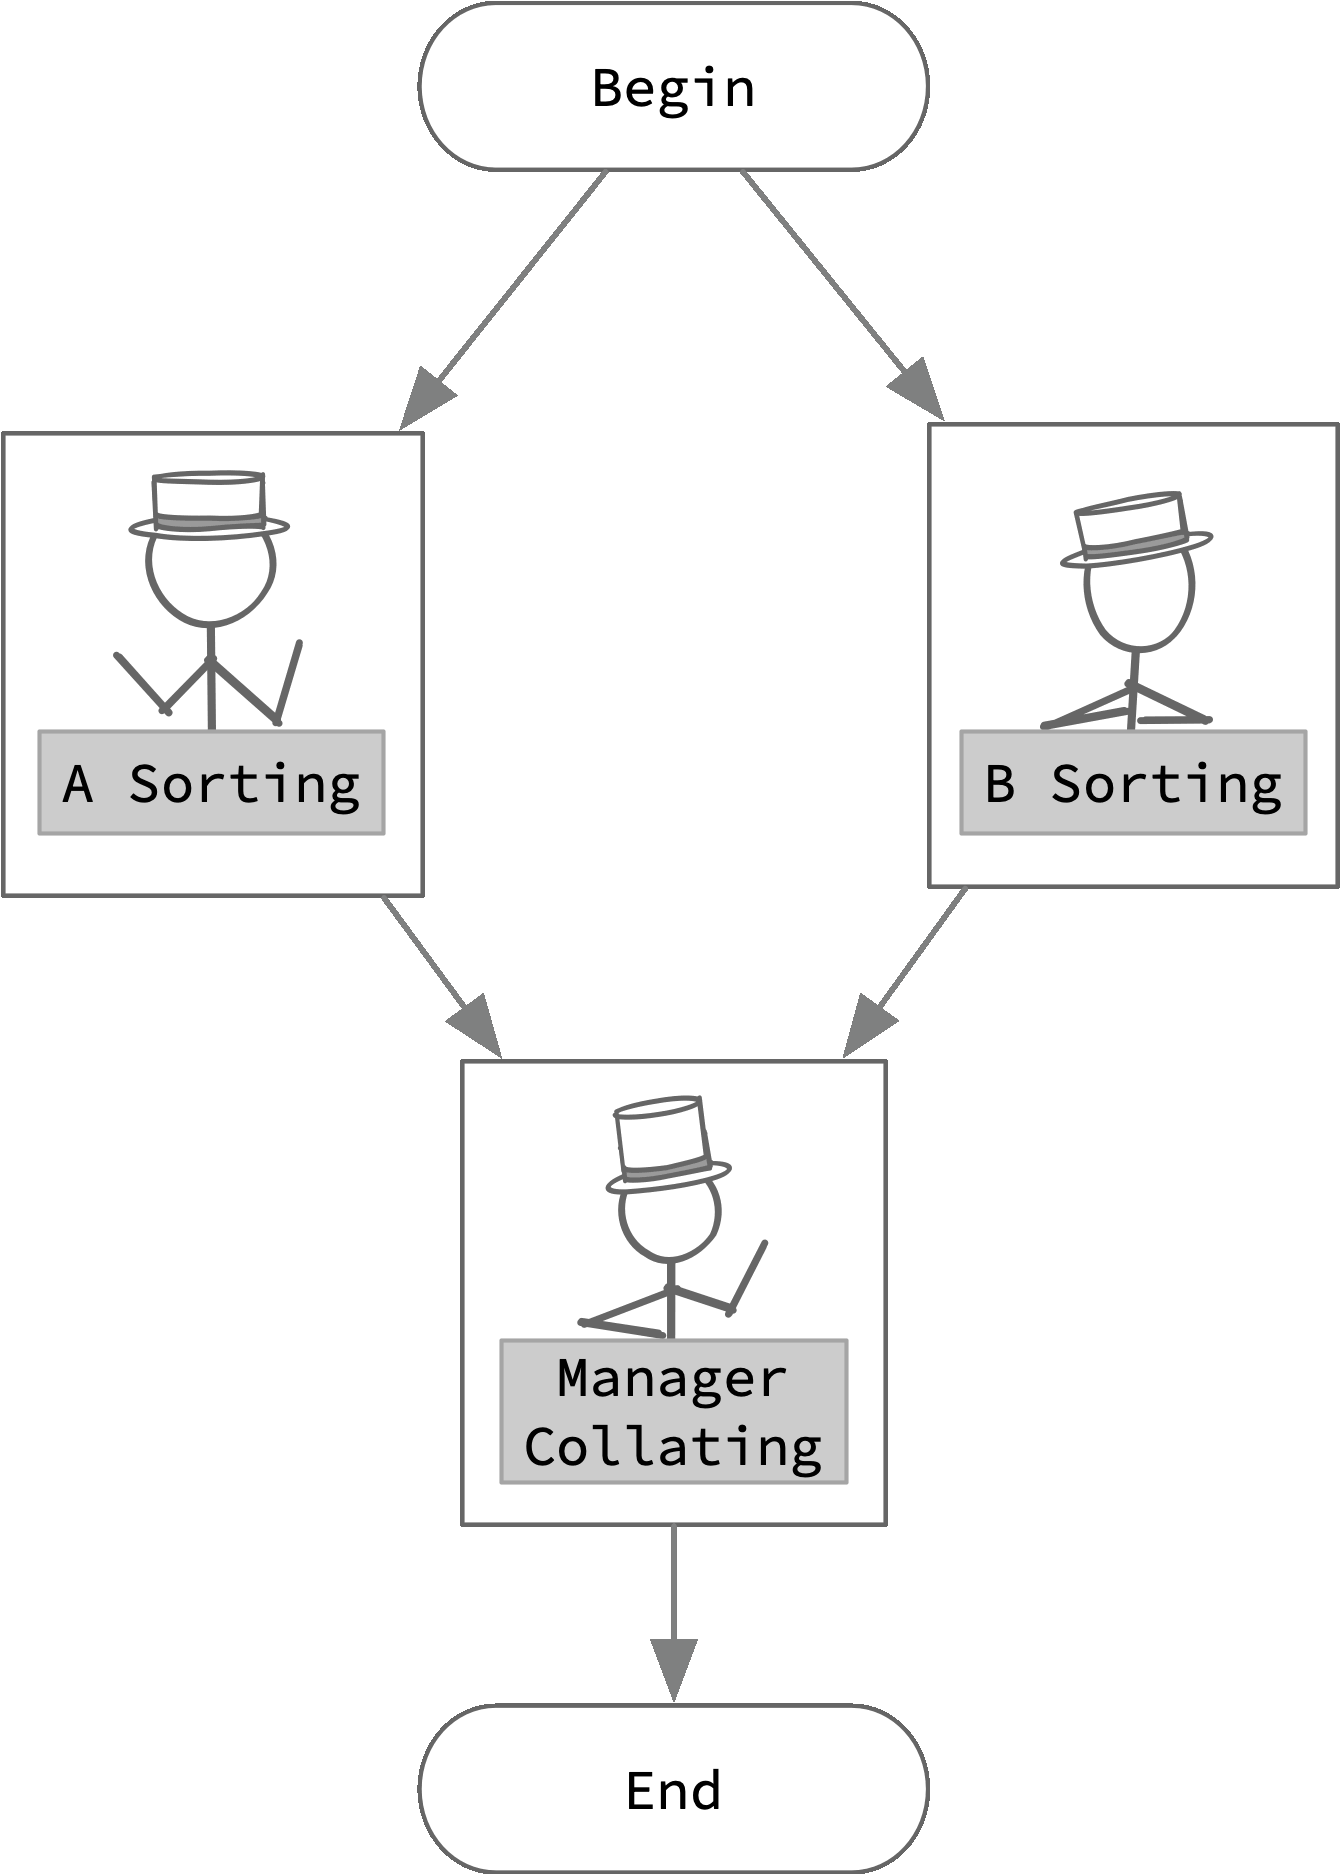
![A directed, diamond-shaped graph that shows two workers working in parallel as a fork in the graph. When the workers are done, the manager must compile the results, so the two parallel braches merge back into one line of execution.](/parallel/intro/CardDependGraph.gif)
Sometimes, it is useful to visualize what workers are doing over time during different steps of a workflow. Visualization can reveal when workers are forced to wait and how dependency between stages impacts the workflow. Adjusting the workflow to minimize the time workers spend waiting will make the workflow more efficient.
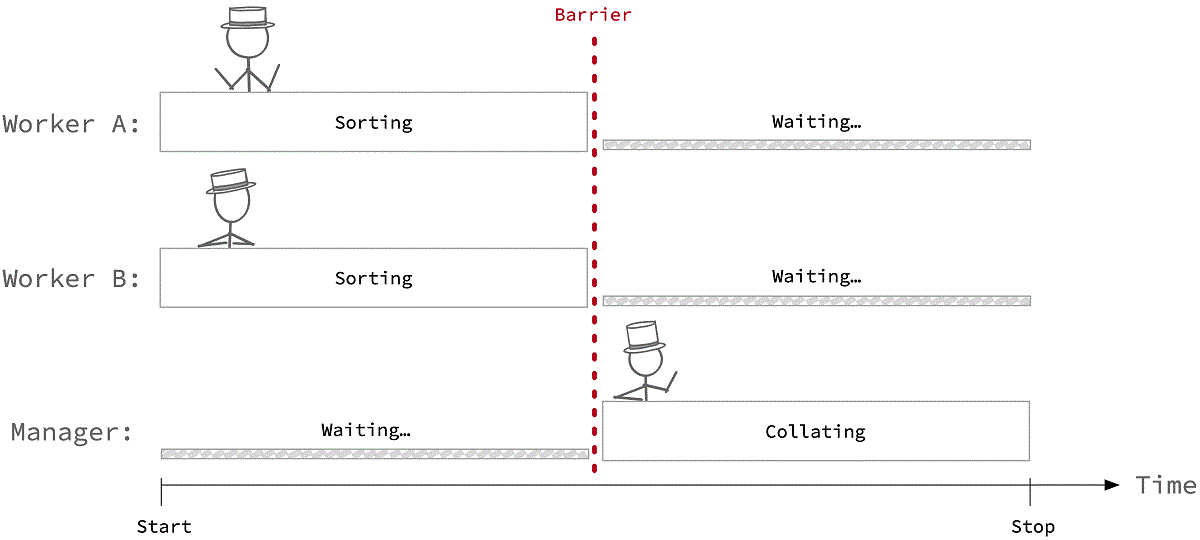
![A timeline of worker activity that corresponds to the diamond-shaped dependency graph. It shows a lane for each of the two workers and a lane for the manager. For the first interval of time, both workers are active while the manager waits. Later, the manager combines the output from the workers while the workers wait.](/parallel/intro/CardOverTime.gif)
In our card sorting workflow, the manager cannot start until all the workers have finished. This task dependency creates a coordination barrier between the sorting and collating parts of the workflow. What happens if one worker finishes more quickly than the other?
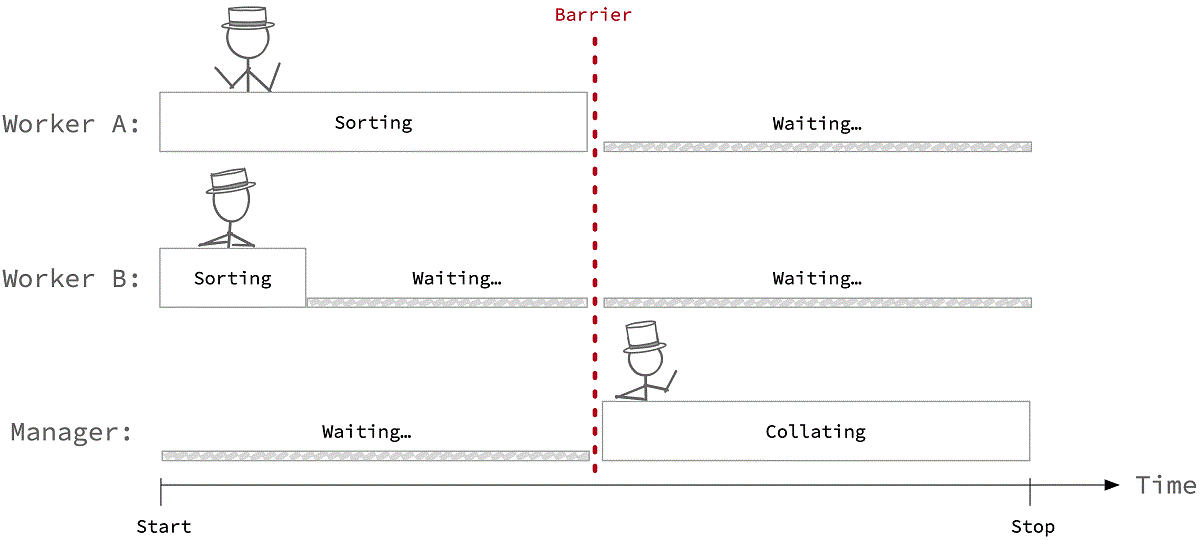
![A timeline of worker activity that corresponds to the diamond-shaped dependency graph. It shows a lane for each of the two workers and a lane for the manager. For the first interval of time, both workers are active while the manager waits. Worker B finishes before Worker A, so there is an interval where both Worker B and the manager are waiting. Later, when both workers have finished, the manager combines the output from the workers while the workers wait.](/parallel/intro/CardOverTimeIdle.gif)
The collating stage cannot proceed until every worker finishes sorting, so the workflow, as a whole, is not faster. When you are writing parallel programs, it is important to distribute the work to minimize idle time. Suppose the work time per task is highly variable. In that case, you might use a manager to dynamically re-distribute the work among workers to keep them all busy.