Intel Advisor
Intel Advisor helps you identify areas in your code that not are getting the full benefit of vectorization or multithreading. It does this by combining static analysis together with runs of the code through an emulator that keeps track of every instruction. It then provides you with guidance on how you might do better. Here is a summary of what you can achieve with its two main parts.
Vectorization and Roofline Advisor
- Evaluate the efficiency of vectorized code and key SIMD bottlenecks
- Provide precise Trip/Call Counts, FLOPS and AVX-512 mask utilization
- Check dynamically for loop-carried dependencies (explained in Vectorization)
- Identify memory vs. compute balance, via automated Roofline and Memory Access Pattern tools
Vectorization Advisor supports analysis of scalar, SSE, AVX, AVX2 and AVX-512-enabled codes generated by the Intel, GNU and Microsoft compilers. It can analyze auto-vectorized code, as well as explicitly vectorized code based on OpenMP 4.x, C/C++ vector intrinsics, or even assembly language.
Threading Advisor
- Discover where to add parallelism to your code by identifying the instruction-heavy areas
- Propose parallel regions through annotations to the source code
- Predict the performance you might achieve with the proposed parallel code regions
- Predict the data sharing problems that could occur in the proposed parallel code regions
Threading Advisor is more of a design and prototyping tool for software architects. It allows you to: analyze, design, tune and check your threading design before implementation; explore and test threading options without disrupting normal development; and predict threading errors and performance scaling on systems with more cores.
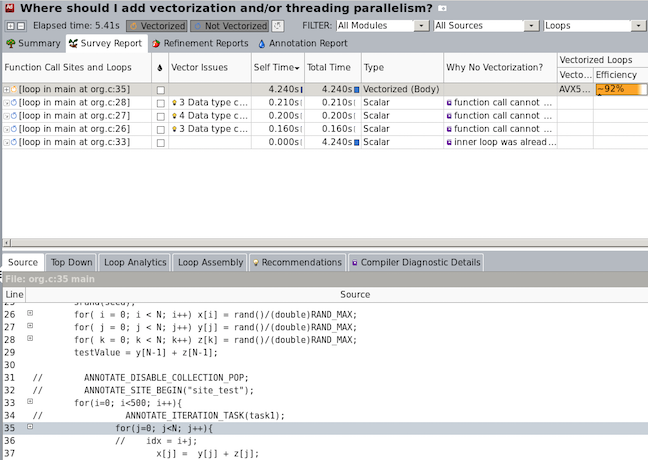
Below is a display of the Advisor's Survey Report, which gives you a window into both parts of the tool. The Survey Report includes dynamic hotspots analysis, cost/benefit/efficiency analysis, and interactive optimization recommendations. Conveniently, it integrates Intel Compiler diagnostics with your source code, so you can view (e.g.) the vectorization report pertaining to each loop.

The command to start the GUI version of Intel Advisor is advisor-gui (or advixe-gui). A command-line version of the tool is provided as well, which is launched with advisor (or advixe-cl). At TACC, both of these commands become available to you once you execute module load advisor.
CVW material development is supported by NSF OAC awards 1854828, 2321040, 2323116 (UT Austin) and 2005506 (Indiana University)