Intel VTune
Intel VTune Profiler provides insight into CPU performance, threading performance, scalability, bandwidth, caching, and more. To do this, it relies on the fact that Intel processors are equipped with numerous hardware counters that tally all sorts of low-level operations in real time while your code is running. VTune collects the tallies from all the cores' counters at frequent intervals; when the run is over, it analyzes the collection and presents the results to you via a well-designed GUI.
Without question, the strength of VTune is its GUI. Using simple point-and-click commands, you can quickly focus on the exact results you want to look at. VTune permits you to sort and filter not just by counter type, but also by code unit and time interval during the run. You can visualize results on the timeline of each core, as well as on the precise lines in your source code.
How to use VTune with your program
- Compile with
-g -lmemkindto provide symbol table and memory access information - Load the TACC module for VTune:
load module vtune - Run the code on one or more compute nodes with VTune Amplifier XE, typically through the Command Line Interface:
vtune(oramplxe-cl) - Analyze and explore the results with VTune Amplifier XE, typically through the Graphical User Interface:
vtune-gui(oramplxe-gui)
Pre-defined collections you can select
| Collection | Information provided |
|---|---|
| hotspots | Profiles of the most time-consuming code sections (user mode) |
| advanced-hotspots | Hotspots, plus cycles per instruction (CPI), with a higher frequency of low-overhead sampling |
| general-exploration | Full hardware event-based sampling, including metrics based on a set of predefined formulas; useful for seeing how efficiently the code's hotspots are passing through the core pipeline |
| concurrency | CPU utilization, plus overhead due to thread synchronization |
| disk-io | Disk I/O preview - disabled on TACC systems (requires root) |
| memory-access | Loads and stores, cache misses, wait times, latencies, and memory bandwidth utilization; events can be attributed to specific arrays (helpful with fine-grained MCDRAM use) |
| hpc-performance | Performance characterization including OpenMP efficiency, memory usage, CPU and FPU utilization, and vectorization info |
The above collections come with "knobs" that allow you to capture extra information; for the knobs that are available in each case, see amplxe-cl -help collect <analysis_type>.
After VTune has collected the data and finalized the analysis, you'll have quite a few options for how to view the results. The first choice is the "viewpoint": typically you'll want to make sure the viewpoint matches the analysis type, but this is not a requirement. The second choice is the window or tab that specifies how VTune should organize the results when presenting them to you. These have names like "Bottom-up", "Top-down tree", etc., depending on the collection and the viewpoint.
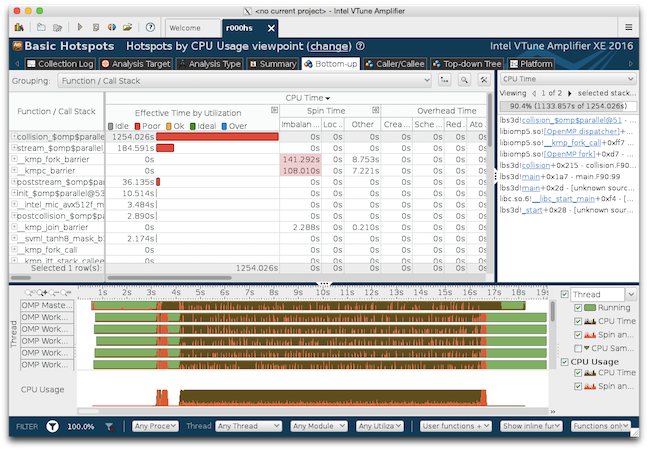
Below is a screenshot of VTune's GUI showing a few of its best features. The main view is a spreadsheet in which the code's routines are ranked according to how busy they are. Excessive times are flagged in pink: in the example, this is true of certain OpenMP barriers. Specific call stacks may be examined on the right. And at the bottom, a timeline is shown for each thread, colored by that thread's state at every instant: idle (green), busy (brown), or waiting (orange).

CVW material development is supported by NSF OAC awards 1854828, 2321040, 2323116 (UT Austin) and 2005506 (Indiana University)