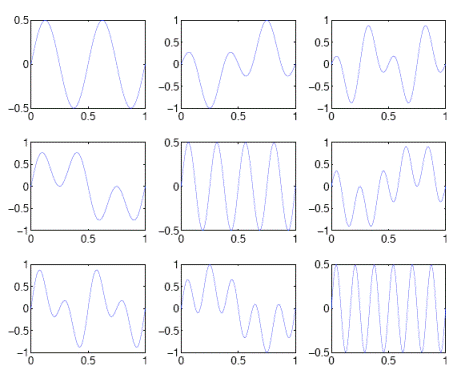
Composite Plots
Most MATLAB users are familiar with the various methods for making two-dimensional plots
(plot, bar, errorbar, etc.).
MATLAB is easy to use and generates very professional-looking plots that are suitable for publications.
The subplot function dramatically extends the basic 2D plotting functionality of MATLAB
by allowing multiple plots to be created on a single page.
Nearby line plots typically enhance the presentation of the data
by immediately highlighting visual contrasts,
and frequently simplify the layout of results in the final publication.
  x=linspace(0,1);
  ctr=1;
  for i=1:3
      for j=1:3
          subplot(3,3,ctr);
          plot(x, sin(i*2*pi*x).*cos(j*2*pi*x));
          set(gca, 'Fontsize', 15);
          ctr = ctr+1;
      end
  end
  orient landscape;
  print('-dpdf', 'subplots.pdf');
The syntax of the subplot function is relatively simple, as it takes three arguments:
the first two are the number of rows (nr) and columns (nc) of plots to place in the final plot
and the final argument is a number between 1 and nr*nc specifying the location of the current plot.
The subplot command subplot command,
the user can then issue plotting commands normally,
including setting options on the current axis, setting font sizes,
and other customizations as shown in the example code.
Note that if there are to be multiple line plots within a single subplot,
separate hold on commands
should be issued within each subplot to prevent
the second and subsequent plots from overwriting the first.
In this example we have also shown the simplest way to produce a PDF of the final plot
using the print

CVW material development is supported by NSF OAC awards 1854828, 2321040, 2323116 (UT Austin) and 2005506 (Indiana University)