DDT Tool
Linaro DDT (Distributed Debugging Tool) is a cross-platform, online, interactive, symbolic debugging tool with an advanced GUI.
It is a component of the Linaro Forge suite of tools (previously Arm Forge, previously Allinea Forge). DDT supports C, C++,
and Fortran compilers including the Intel compilers on Frontera. It also includes
support for hybrid programming using MPI and OpenMP. Like other
debuggers, it requires code augmented with debugging symbols, added by using the
compiler's -g option. To run DDT on Frontera, enter the following commands:
The DDT main window is shown below. Like some IDEs (Integrated Development Environments for software), DDT includes a project-oriented source code viewer and editor. In this example, execution is frozen at a breakpoint (highlighted in red) and the user is able to view detailed information about the current state of the program including variable values and stack traces across the entire MPI domain. Using the process control buttons located at the top of the window, the developer can view separate task processes individually or in groups.
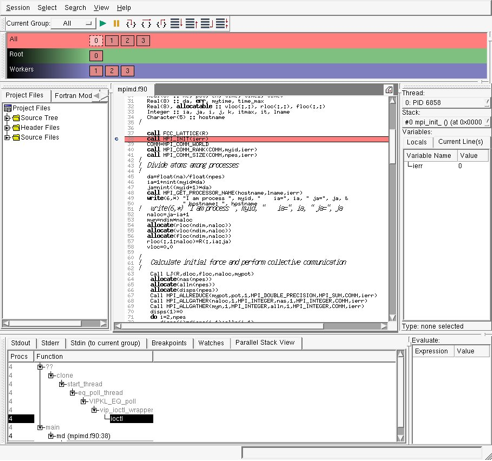
Using the "evaluate" pane (lower right), the developer may enter expressions to be evaluated in the execution context of the task being viewed. In the "variable" pane (just above it), values of variables appearing on the highlighted line of source code are available for viewing and modification.
CVW material development is supported by NSF OAC awards 1854828, 2321040, 2323116 (UT Austin) and 2005506 (Indiana University)