Profiling
Douglas Fuller, Arizona State (original author), Steve Lantz
Cornell Center for Advanced Computing
Revisions: 10/2023, 7/2014, 3/2008 (original)
Profiling means measuring the performance characteristics of a running application, for the purpose of identifying compute-intensive areas—often called "hot spots"—that may be worth improving. In general, profiling can suffer from an "observer effect" in that the act of collecting performance data about an application while it executes may significantly degrade performance. When the goal of profiling is to locate relative performance hot spots in an application, this is not a problem. When the goal is to characterize actual performance characteristics of an application as it operates in the field, this observer effect is undesirable.
There are two main approaches to profiling an application: instrumentation and statistical sampling. Instrumentation involves adding instructions to an application to collect information (function call duration, number of invocations, etc.). As this method inherently alters the execution of a program, it is most often associated with degrading the performance of the application as a whole while it is being profiled.
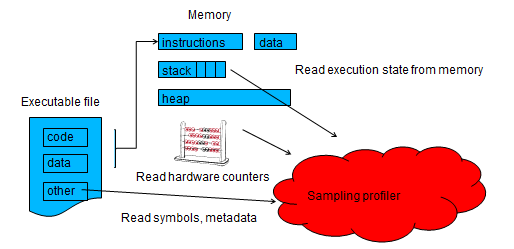
Statistical sampling involves querying the state of unmodified executable at regular intervals. This results in a less comprehensive set of measurements as achievable through instrumentation, but usually does not degrade the performance of an application at all.
Objectives
After you complete this topic, you should be able to:
- Define the term "hot spot"
- Distinguish between instrumentation and statistical sampling
- Define "wall time" and "user time" and differentiate between the two
- Name several standard timing utilities and functions
- Demonstrate function-level profiling with
gprof - Describe how
gprofmay be used in parallel - Identify the kinds of events tracked by PAPI
- Explain how PAPI conveys an advantage in code portability
- Demonstrate profiling an MPI application with TAU
- Describe the roles of
tauexandpprofwithin TAU - Explain the difference between profiling and tracing
Prerequisites
This topic presumes a basic knowledge of Linux/Unix. Although specific programming knowledge is not required, it will provide significantly enhanced context and understanding. Most of the tools presented apply equally well to C, C++, and Fortran. The topic is not constructed with any of these languages specifically in mind.
CVW material development is supported by NSF OAC awards 1854828, 2321040, 2323116 (UT Austin) and 2005506 (Indiana University)