Symbolic
Symbolic debugging involves directly inspecting the state of a running program, using debugging symbols embedded in the executable to correlate memory locations or stack frames to specific variables or lines of code. Likewise, symbolic debuggers are capable of controlling the execution of an application; stopping it at certain points for inspection, or slowly stepping through its execution instruction-by-instruction so that its control flow can be observed. Thus, symbolic debugging involves:
- Compiling an application with debugging symbols enabled. This is typically some sort of compilation flag such as
-g - Using a debugger to launch the application, or attach to an application that is already running
- Defining "breakpoints": marking lines of code or other conditions that cause the debugger to pause execution of the application and provide access to the variables in memory
- Stepping through program execution and inspecting the contents of memory
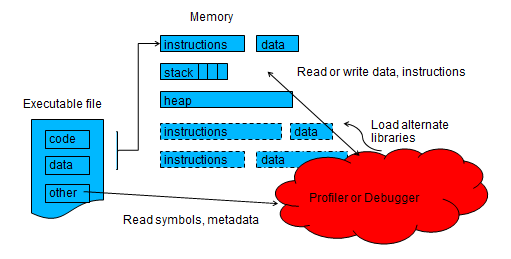
Symbolic debuggers look for the presence of debugging symbols present in an executable file, which provide a mapping between machine instructions and human-readable text such as line number, variable names, etc. When
compiling with debugging enabled (-g), all this does is instruct the compiler to include this additional metadata in the executable file. In general, this does not affect the performance of an application, as it
does not alter any machine instructions. Usually, its only effect is in making the size of an executable larger due to appending this metadata to it.
CVW material development is supported by NSF OAC awards 1854828, 2321040, 2323116 (UT Austin) and 2005506 (Indiana University)