Clustering
Clustering represents a set of methods in unsupervised machine learning that aims to group data elements into subsets based on a shared similarity. As such, a clustering method must define what it means for two data elements to be "similar". k-means clustering is a widely used clustering algorithm that divides a dataset into k different subsets (for specified integer k), based upon a Euclidean distance metric between two points in the data space (such that two data points that are identical are separated by distance 0 and are maximally similar to each other). k-means clustering (also called K-Means, or KMeans) defines a set of centroids or centers in the data space, with one center for each cluster, such that every data point within the cluster is closer to its own center than to some other cluster's center. k-means clustering is discussed in the scikit-learn documentation, along with many other clustering algorithms.
In this case, we're interested in clustering the baseball batting data, to find players who had similar batting statistics over their careers. There is no one correct way to make such a comparison, especially since players had careers that lasted for differing lengths, although one might hope to correct for at least some of that bias. In the code below, we normalize each player's career batting totals by their total number of at-bats, so that each hitting statistic represents a rate per at-bat (per_ab). In the code cell below, we first do some data processing to prepare a new dataframe named pl_bat_per_ab. With this dataframe, each player's career batting statistics are summarized by 15 features, or as a point in a 15-dimensional space. We want to cluster players based upon similarity of these feature vectors. Follow along in the accompanying Jupyter notebook for more details and to carry out these computations on your own.
Scikit-learn provides a class for carrying out k-means clustering in sklearn.cluster.KMeans. Because different components of the feature vector can have different characteristic scales, it is sometimes useful to preprocess the data to make such variation consistent across components. The StandardScaler object provided by sklearn can be used to scale the raw data such that each column has zero mean and unit variance.
After preprocessing, we can carry out k-means clustering with a specified number of clusters k. In this example, we arbitrarily choose k=10, but one typically wants to carry out such clustering for different k and assess the results. After clustering, various aspects of the clustering can be examined, such as which data points are grouped together, and what the cluster centers look like. It should be noted that the act of clustering assigns cluster labels to each data point, but the numerical value of those labels is arbitrary, and will change from run to run since k-means has some stochastic elements in it. What is more meaningful is which data points get clustered together (regardless of the specific label).
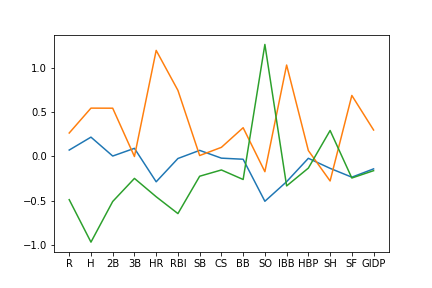
The Baseball Databank also contains information about who has been inducted into the Baseball Hall of Fame (HOF). While the Hall of Fame includes inductees such as managers and umpires who might have undistinguished or nonexistent major league baseball playing careers, most of the members are inducted due to their superior playing performance. So it might be interesting to see whether the clustering of hitting statistics above reflects at all the superior play characteristic of HOF players. The code cells below compute the number of HOF members in each of our k=10 clusters, identifies which clusters have the most HOF players, and then plots the cluster centers for the 3 clusters that contain almost all of the HOF players.
It is worth noting here (and this issue will be revisited later) that there are fundamentally two different types of players in baseball: Pitchers and Position Players (the latter of which we might refer to below simply as "Players"). Pitchers play a specialized role in the game of baseball (something like the way that goalies are differentiated in sports that involve a goalie), and it is their pitching skills that are valued rather than their hitting skills. So we would generally expect that pitchers (even HOF pitchers) might stand out as a separate subset of players when we examine only their batting/hitting statistics.
In the figure below, we plot the three cluster centers most associated with HOF players. For those clusters, you should probably be able to see that one cluster emphasizes players who are able to hit home runs (HR), another cluster involves players who get a lot of hits (H) but not so many HR, and a third cluster involves players who hit less well and have lots of strike outs (SO). These first two clusters mostly reflect Position Players with different batting characteristics, while the third mostly reflects Pitchers who do not hit well but possess other skills.

CVW material development is supported by NSF OAC awards 1854828, 2321040, 2323116 (UT Austin) and 2005506 (Indiana University)