Aggregate Operations on Data
Aggregate operations
In addition to defining multidimensional array objects, NumPy also supports compact and efficient aggregate operations for operating on all data in an array, as described in further detail in our companion material. This same functionality has been extended to Pandas, to allow for aggregate operations on dataframes. This includes mathematical operations such as sum, mean, std, min, max, abs, and round, among others. Many of these functions can act not only over an entire array or dataframe, but also along a particular axis. (This is one of the reasons it's important to know about the anatomy of arrays and dataframes.) We'll give a few simple examples here. We'll also see below the use of aggregations in conjunction with grouping operations.
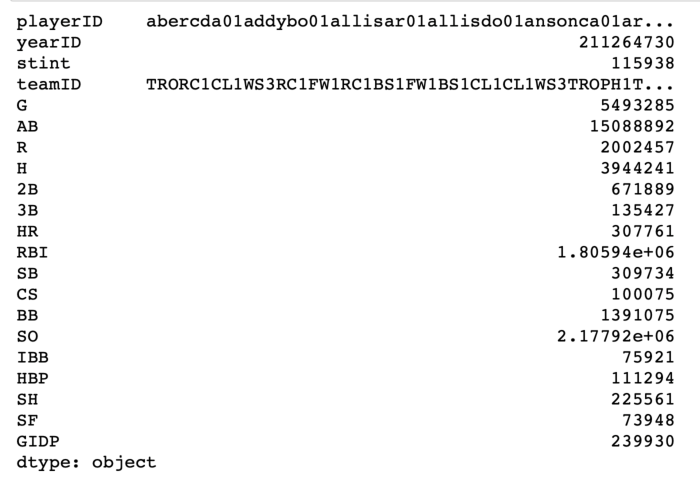
With the baseball batting dataframe, we might be interested in the total number of different types of hitting outcomes over the entire history of MLB baseball. We can easily compute this by summing all the rows (axis=0) of the batting dataframe:

Some of the output is a bit nonsensical (e.g., summing text strings). If we want to restrict the summation
to only numeric data, we can include an additional option to the sum method: batting.sum(axis=1, numeric_only=True), although even though, some of the data are still somewhat nonsensical (e.g., summing years).
Similarly, we might be interested in how many games per season players have played on average. The following code will return both the mean and standard deviation of the yearly number of games ('G') per player:
We will revisit these aggregate operations in further detail in subsequent pages.
CVW material development is supported by NSF OAC awards 1854828, 2321040, 2323116 (UT Austin) and 2005506 (Indiana University)