Property Animations
Many of the Source and Filter nodes in a visualization pipeline contain property values that can be altered over the course of an animation. For instance, most node types include Visibility and Opacity properties that can be used to hide nodes for part of an animation or gradually alter their opacity. Additionally, each different type of node has parameters that are specific to its functionality, and altering these values over time can often produce compelling visualization effects. In this section we will animate a node property to demonstrate this ability.
The following steps will prepare the data needed for this example:
- Edit→Reset Session to reset the pipeline and animation view.
- File→Open "headsq.vti" to load the headsq.vtk data set, then click "Apply".
- Filters→Common→Slice to add a Slice filter to the headsq.vtk data.
- Uncheck "Show Plane" in the Properties Panel.
- Click the "Z Normal" button in the Properties Panel, then click "Apply".
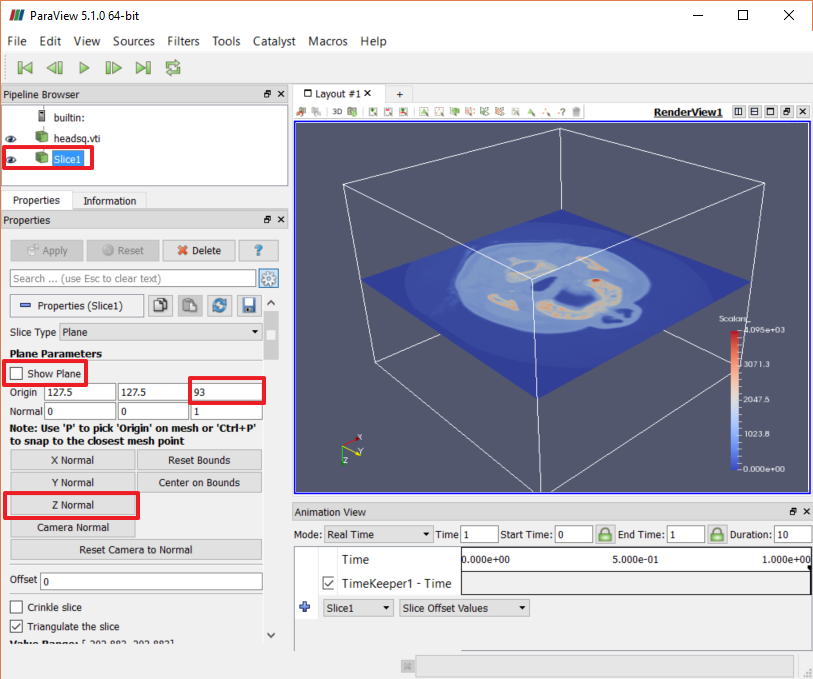
Notice that when the Slice node's Z axis is selected, the Z coordinate of the "Origin" is initially 93, which is in the center of the data set's Z bounds. We can animate an "offset" that is applied to this Z value in order to move the slice plane through the data set over time. At the bottom of the Animation View, select the "Slice1" node in the left dropdown and then select "Slice Offset Values" in the right dropdown. Click "+" on the left to create a new animation element.
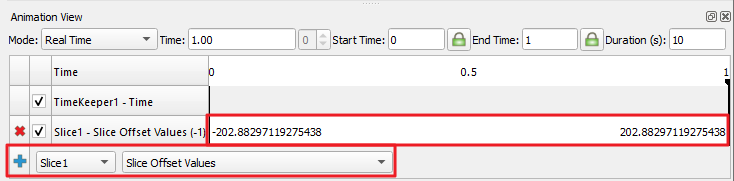
If you click Play right now, the slice plane may move in unexpected ways during the animation. This is because the we have not yet defined the way in which the offset value is to be modified during the animation. Looking at the right side of the new animation element, we see that the offset value is being "ramped" from a value of about -202 (on the left) to about 202 (on the right). To change this, double-click the animation element to bring up the "Animation Keyframes" dialog for the element.
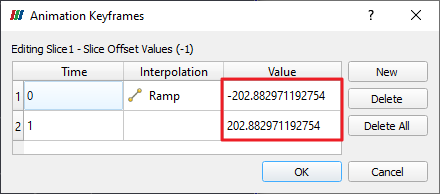
In this dialog we can set "keyframes" to specify how the offset value should change over time. You can add any number of keyframes, assigning them incrementing "Time" values from 0 to 1 in the left column. On each row you can assign a target "Value" in the right column, along with an interpolation method by double-clicking the middle column.
For this example, leave the two rows at times 0 and 1. We only want the offset to range within the Z bounds of the data (-92 to 92) and let's say that we want it to move from the bottom of the view (92) to the top (-92). Set the value for the first row to 92 and the value for the second row to -92, then click "OK". Make sure the Animation mode is "Real Time" and the Duration is 10 seconds, then press Play and you should see the slice move from the bottom of the data space to the top.
CVW material development is supported by NSF OAC awards 1854828, 2321040, 2323116 (UT Austin) and 2005506 (Indiana University)