Modeling Wildfire Dynamics
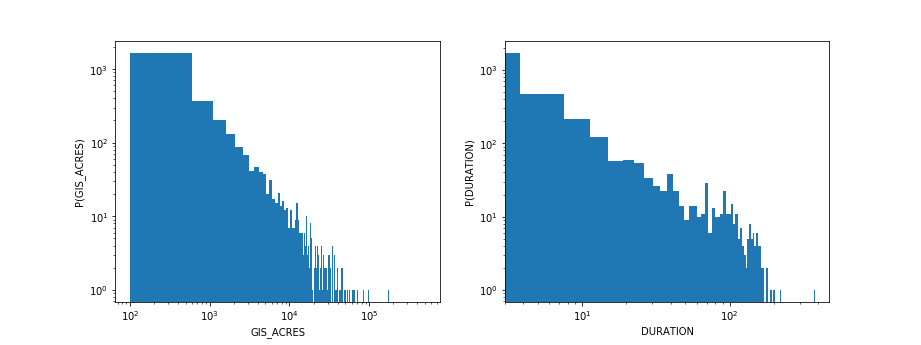
In our analysis of historical California wildfires, we saw that the sizes and durations of fires are broadly distributed, with heavy tails approximated by power laws. In other words, there does not appear to be a "typical" size or duration of a wildfire, but they occur across a broad range of scales, with many small fires but some very large ones as well, as is seen in this image.

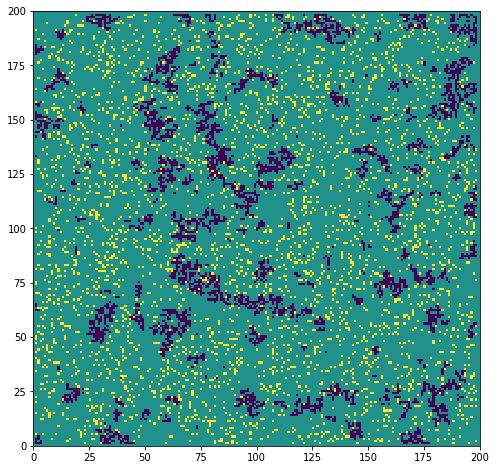
In the study of complex, nonequilibrium systems, wildfires (or "forest fires", as they are sometimes called) have arisen as one of several important conceptual model systems for understanding these sorts of dynamical, self-organizing, spatiotemporal processes. A class of very simplified computational models that ignore many of the details of actual wildfires have been developed that enable one to understand the role of different sorts of processes. In these models, fires are started at a specific location (typically through a simulated lightning strike), spread to neighboring trees in a forest (typically simulated as a 2D lattice), and then self-extinguish once there are no more nearby trees to burn. Over time, new trees grow where trees previously burned, adding more potential fuel for future fires, and the process repeats itself. In these models, over long times, a "forest" can converge to a statistical steady state where fires occur over a large range of length and time scales, with a fractal distribution of trees scattered across the landscape, such as is captured in the image below. In the image, the sites in the forest that are purple are those that have burned recently (forming spindly, but connected, clusters), the sites that are yellow are new trees that have sprung up at random recently, and the sites that are green have seen no activity recently.
 <
<
We include an accompanying Jupyter notebook on Wildfire Modeling to lead interested readers through the development of such a simulation. In this model, we do not "close the loop" by returning to the actual historical wildfire data, but are rather simply motivated by some of the phenomena observable in the data. Ultimately, if one wanted to use computational models to parameterize actual fires and make predictions about future events (e.g., to decide how to best control fires), one would need a more realistic model. But this exercise introduces a variety of concepts and techniques that are useful for developing mechanistic, process-based models of complex systems.
The material presented in the accompanying notebook was developed originally to support the NASA Data Intensive Research and Education Center for STEM (DIRECT-STEM) at CSULA, through its partnership with XSEDE.
CVW material development is supported by NSF OAC awards 1854828, 2321040, 2323116 (UT Austin) and 2005506 (Indiana University)