Interactive Visualization
Bokeh
Standard data visualization tools such as matplotlib and seaborn are great for making plots, but sometimes a more interactive data visualization environment is useful for stimulating additional insights. In this example we will use Bokeh to include supplementary data from the tweet data that we've been working with in an interactive visualization including the user's screen name, the tweet text, and the tweet timestamp to provide even more insight into this tweet's 'second life'.
We introduced Bokeh briefly in Part 1 of this tutorial, but we examine it in more detail here. Bokeh works by generating plots in web browsers, combining a high-level Python programming interface that generates javascript (js) code to display HTML documents in a browser. The plotting interface is a bit different than what we've seen in matplotlib and seaborn, emphasizing the plotting of various types of glyphs. This is described in more detail in the Bokeh user's guide. One of the key new datatypes that Bokeh introduces is a ColumnDataSource, which is similar in some ways to a Pandas dataframe in that it holds various data arrays keyed by a name; one or more ColumnDataSources are typically used to organize data of interest, which then serve as the source for glyph production in various plotting functions. In the material shown below, we pack all the data of interest into a ColumnDataSource that we can use in conjunction with a scatter plot routine, to visualize tweet and retweet data.
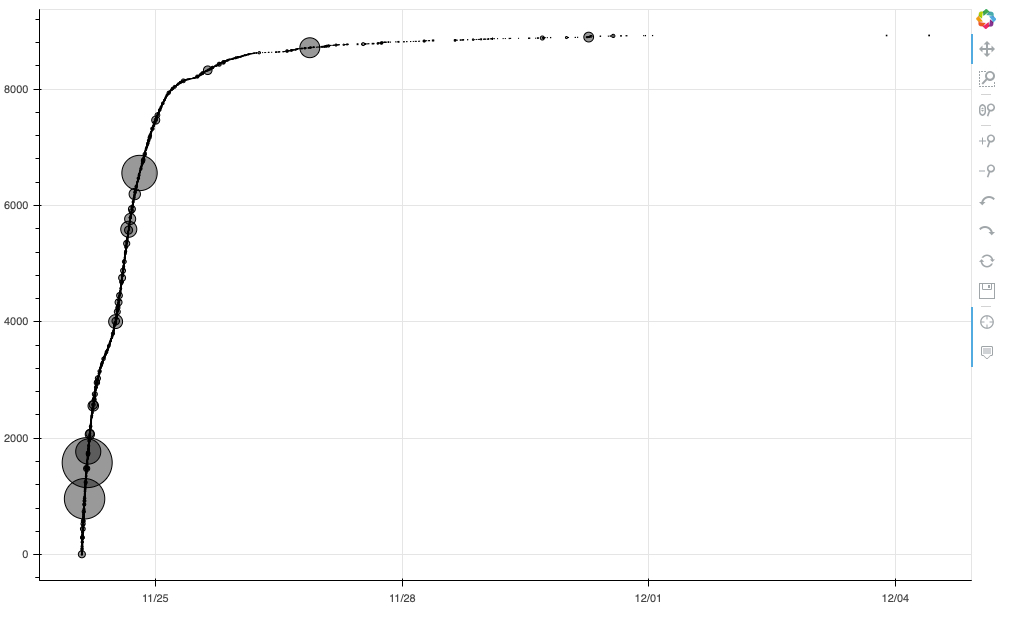
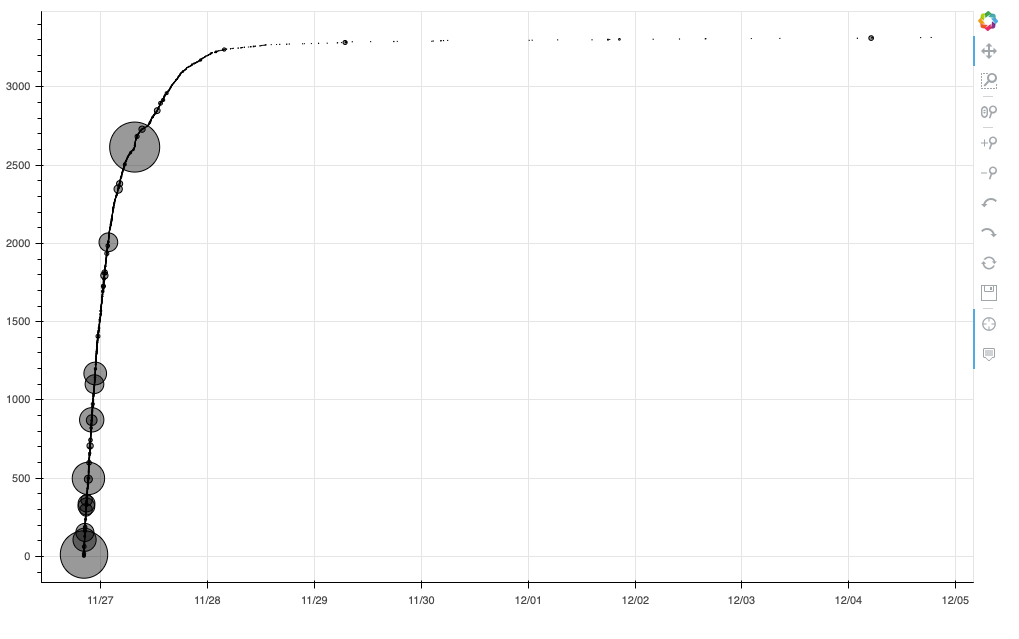
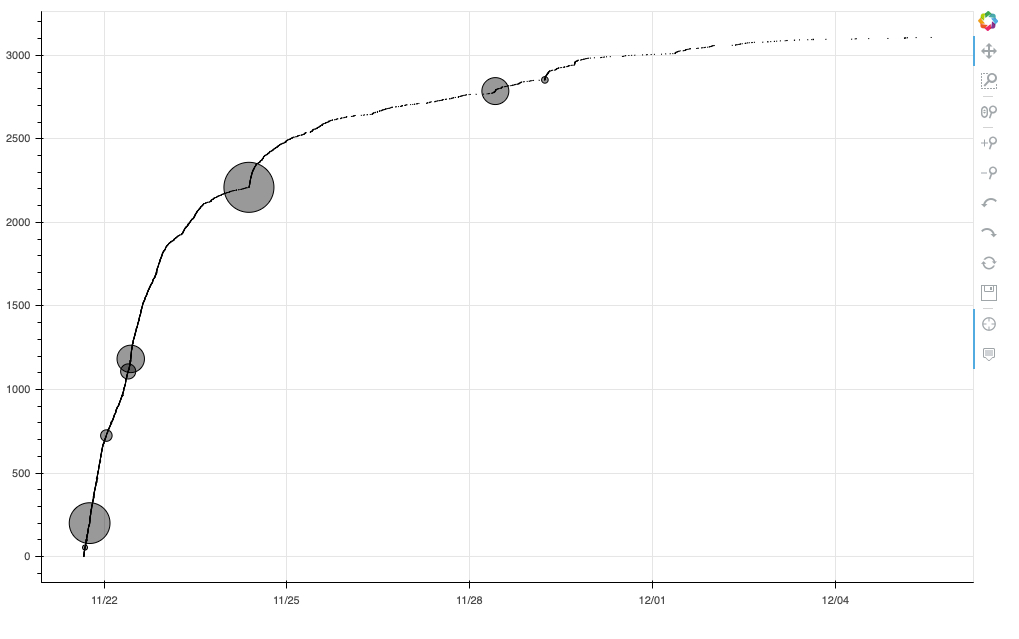
The code below — drawn from a Jupyter notebook in the github repository for this tutorial — creates a cumulative timeline plot and scales each point with the followers count of the Twitter account that retweeted that specific tweet. If you run the code in the notebook (which itself runs in a browser), new HTML documents are created, and then displayed in new browser windows or tabs. At the bottom of this page are three static images, one for each of the top three retweets that are plotted using the code displayed. Each image is actually a hyperlink, however, to an HTML page hosting an interactive Bokeh visualization of the data.
Bokeh can be used either to produce HTML files (such as those linked here) to provide some degree of user interaction, or to run a much more interactive webserver that can make changes to what is displayed based on user input. In server mode, one can write callback functions in Python to respond to user inputs, transform data based on user interactions, and modify the makeup of data plots. Several demo applications illustrate some of this functionality and provide links to underlying source code.
Visualizing Retweet Activity
In the code below, a ColumnDataSource is populated with various data fields drawn from a dataframe named top_retweets, which is created in full in the accompanying notebook. Each row in the dataframe corresponds to a tweet, and each column contains particular data fields. The code below also adds a new derived data column named 'followers_count_scaled' by applying an on-the-fly Python lambda function to each tweet in the dataframe. The main plotting action is taking place in the line that begins with p.scatter, where the relevant tweet data are all passed in through the ColumnDataSource.
As noted, each image below is a hyperlink to a separate HTML page, so you can click on an image to examine the associated data. Each plot has a panel of tools on the right, supporting actions like panning and zooming. Hover over the gray circles to display additional metadata. The size of the circle surrounding each point is given by the number of followers (scaled). By hovering to access the metadata and examining the structure of the retweet timeline, you can identify brief bursts of additional retweeting. Having this additional interactivity provides a significant advantage towards gaining insight into a complex dataset.
CVW material development is supported by NSF OAC awards 1854828, 2321040, 2323116 (UT Austin) and 2005506 (Indiana University)


