A History of Baseball
Visualization is a useful way of summarizing complex datasets. We can use various visualization tools, for example, to summarize the entire history of hitting (batting) in baseball. To do this, we will make use of the seaborn package (conventionally imported as sns).
We are specifically interested here not only in the four types of hits, but also some other key batting outcomes: strikeouts (SO) and bases-on-balls (BB), otherwise known as walks, as well as runs scored (R) and runs batted in (RBI). Thus we will restrict our attention to the following set of variables in the batting dataframe: hit_vars = ('1B', '2B', '3B', 'HR', 'SO', 'BB', 'R', 'RBI').
The dataframe batting_by_year that we created in the page on groupby operations is useful for some analyses, but is also confounded by the fact that MLB baseball has grown over time, both in terms of the number of teams in the league and the number of games played in a season. Thus, per-year totals have grown over time partly due to the simple fact that the number of overall games played and at-bats per season have increased. Below we will create a new dataframe that accounts for this effect, by computing batting statistics on a per at-bat (AB) basis.
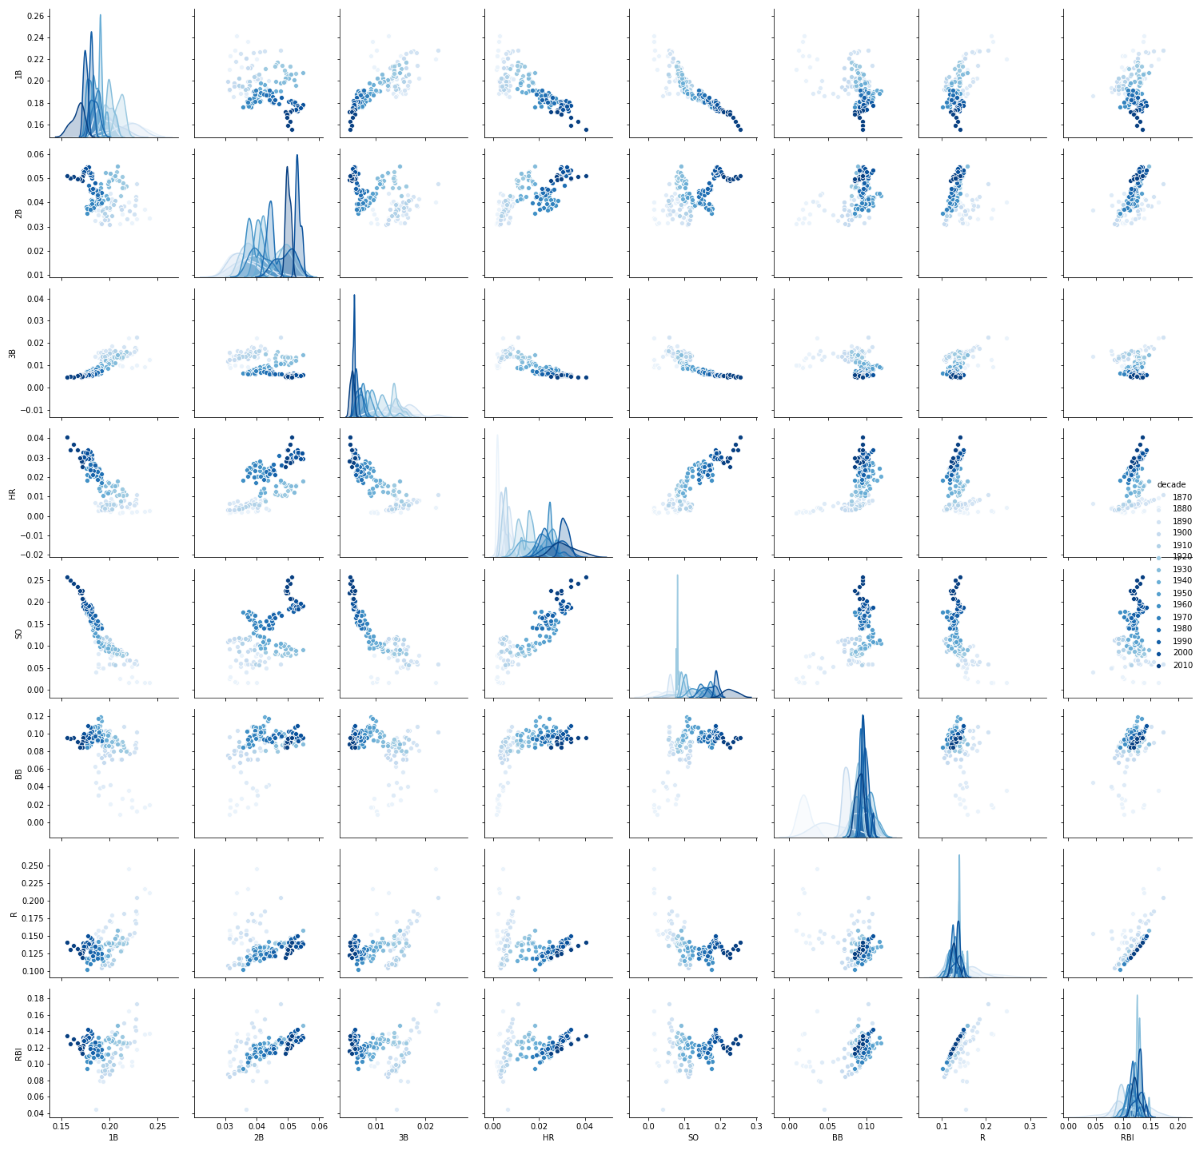
A PairGrid is used to plot the relationship between all pairs of variables of interest (e.g., hit_vars), with which we can overlay with additional color information to present a succinct history of hitting in baseball.
Seaborn (sns) provides a convenience function named pairplot that generates such a pairwise plot, with scatter plots among variables in the off-diagonal grid cells, and histograms of each variable along the diagonal. By coloring these plots with time information, we can view the history of hitting in baseball as it unfolds over the decades. In order to better see the progression of time in this visualization, it is useful to bin the year-by-year data into decades, which can do by adding a new column to the dataframe (decade) that computes this using the np.floor_divide on each row. Time progresses from light to dark blue in these plots.

There is a rich history to be discovered here. Along the diagonals, we can get a sense of how different hitting outcomes have changed over time (from light to dark): 1B and 3B hits have decreased, home runs (HR) and strikeouts (SO) have generally increased, and 2B hits have taken a more up-and-down path over time. Perhaps the most strongly correlated pair of outcomes involve HR and SO, which most people currently paying attention to MLB baseball will surely recognize.
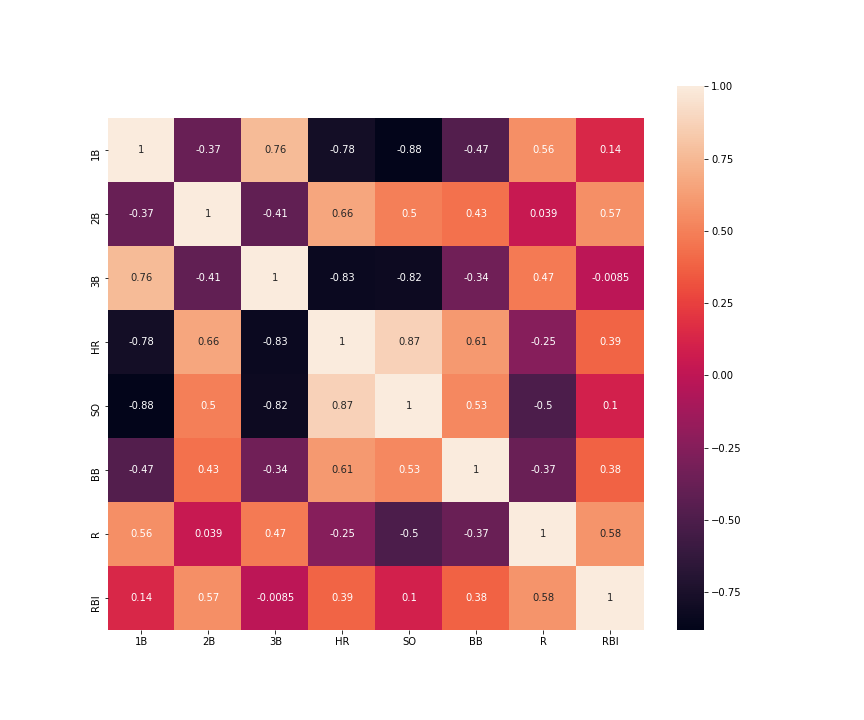
We can summarize the pairwise correlations among hitting outcomes embedded in the scatter plot data above by using the corr() method on the hit_vars subset of the dataframe, and then displaying all the correlation values with a heat map. This in fact confirms our sense that the HR-SO correlation is the strongest among all the hitting variables.

The Saga of Home Runs
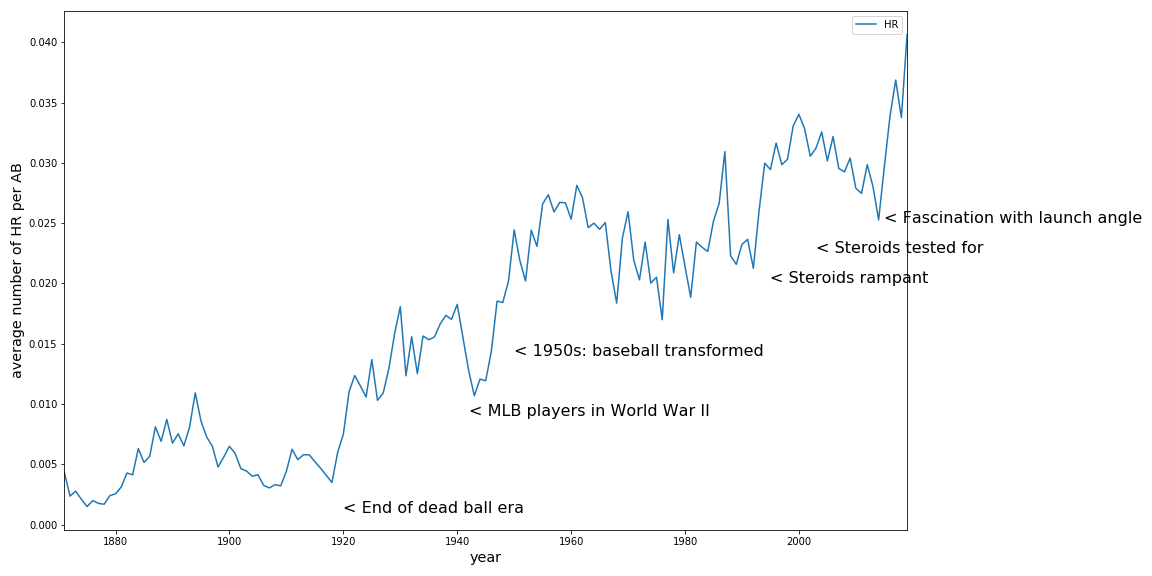
For many baseball fans, the most exciting part of the sport is the home run. From our earlier hitting scatter plot, we saw that the rate of home runs has increased steadily over time. We can examine this in a bit more detail by plotting the rate of HR per AB over time, using the plot method on the batting_per_AB_by_year dataframe. The code block below also includes some annotations relevant to the history of home runs in baseball, added using the plt.text function from matplotlib. (For more information about how baseball was transformed in the 1950s, read this blog post). MLB baseball in recent years has set multiple records for most home runs in a season, and many are debating how to try to keep the game from devolving into an endless series of strikeouts, walks, and home runs.

CVW material development is supported by NSF OAC awards 1854828, 2321040, 2323116 (UT Austin) and 2005506 (Indiana University)