Web Interface
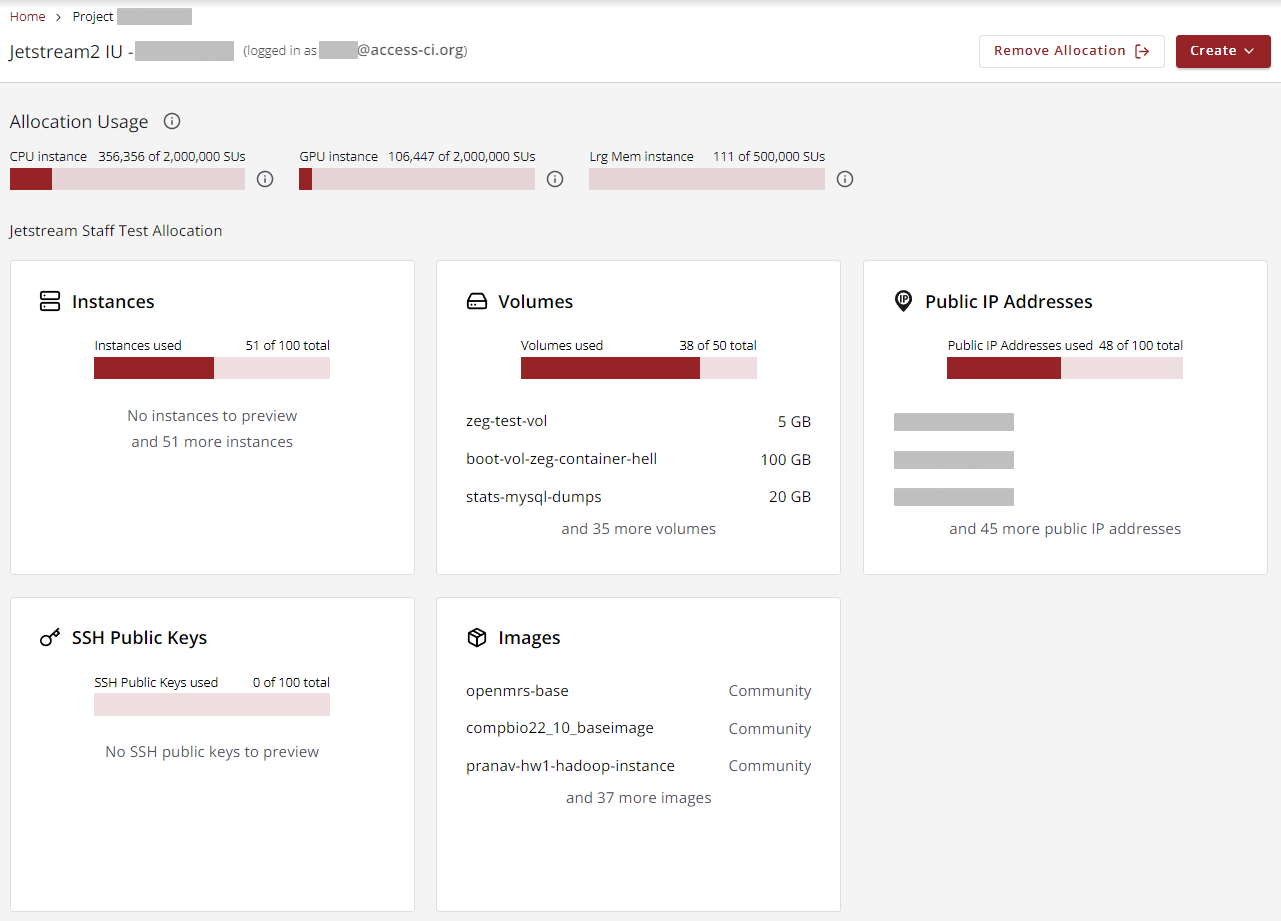
When you are logged in to Jetstream2's Exosphere site and have selected an allocation, you will see a dashboard for that allocation which is typically comprised of three parts:
-
A header displaying the current allocation and your login,
as well as navigation
breadcrumbs
and a menu for creating cloud components. - A status section displaying the amounts of the allocation's resources that have been used.
- A set of summaries for your allocation, one for each of five different types of cloud components.
These dashboard sections are described below.

Allocation Section
The top-most section of the dashboard displays the name of the active allocation and the Id of the user who is currently logged in.
Above that information are breadcrumbs
that allow you to navigate back to the allocation selection view (Home
),
or the current allocation's dashboard.
On the right are buttons to remove the current allocation from the list of active allocations
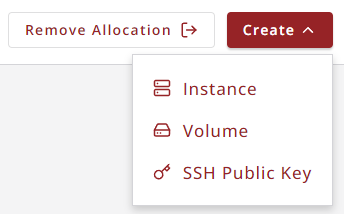
and a dropdown menu that allows you to create some of the most common types of cloud components.
The use of this menu will be described in appropriate pages of other topics in this roadmap.

Usage Section
The second section of the dashboard displays the used and total amounts for each type of resource in the allocation. There are situations where this part of the dashboard may not be displayed.
Component Section
The third section of the dashboard displays usage summaries for five types of cloud components. Clicking on any of the component summaries (Instances, Volumes, Public IP Addresses, SSH Keys, and Images) will take you to a different dashboard view that focuses on that component. Other topics in this roadmap will describe each of these component sections in detail.
CVW material development is supported by NSF OAC awards 1854828, 2321040, 2323116 (UT Austin) and 2005506 (Indiana University)