Exercise
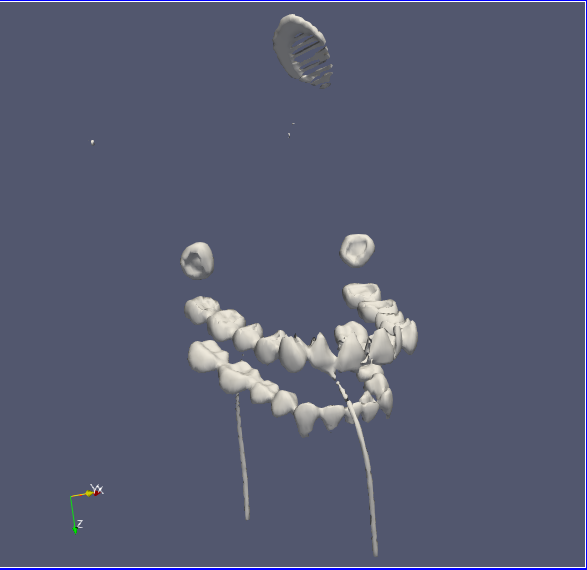
Generate a Contour of the Teeth in Headsq.vti
Use the techniques discussed in this section
to generate an image of the teeth in the headsq.vti data set:
- Load the
headsq.vtkdata set into ParaView. - Find the Z axis location where a slice through the data clearly shows the teeth.
- Use a Plot Over Line filter to sample along a line through some teeth.
- Plot the density values along that line to determine an approximate density value representing the boundaries of the teeth.
- Use that density value in a Contour filter to show the surfaces of the teeth (a few other parts of the data will be visible as well).
©
|
Cornell University
|
Center for Advanced Computing
|
Copyright Statement
|
Access Statement
CVW material development is supported by NSF OAC awards 1854828, 2321040, 2323116 (UT Austin) and 2005506 (Indiana University)
CVW material development is supported by NSF OAC awards 1854828, 2321040, 2323116 (UT Austin) and 2005506 (Indiana University)