Slice View
In our example, we want to create isosurfaces where the data's density values correlate with skin and bone. To determine which density values to use, we need to inspect the data at a location where we can easily tell which voxels represent skin and bone. How can we quickly find that location in the data?
One option is to use a Slice View to see cross sections of the data. The Slice View lets you create orthogonal viewing planes within the data and move them around to quickly explore the data set contents.
First, lets load the appropriate data and create the Slice View:
- Reset ParaView with Edit→Reset Session.
- Open the data set with File→Open, selecting the file "headsq.vtk". Click "Apply" in the Properties panel.
- Create a Slice View by clicking the Render View's "Split Horizontal" button. In the newly created view, click "Slice View".
- Note in the Pipeline Browser that the data set is not initially visible in the new view. Make it visible.
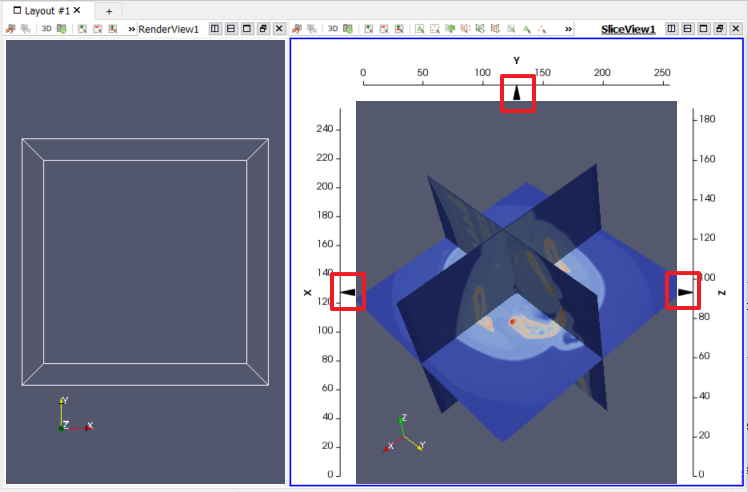
- The initial view is down the Z axis. Rotate the camera until you can see all three slice planes.

Along three sides of the view are axes showing the spatial bounds of the data in X, Y and Z. Each axis initially contains one grip at its center, where the default slice planes are located. These grips can be manipulated in the following ways:
- Dragging a grip repositions that plane along its orthogonal axis.
- Double-clicking along an axis either deletes the plane at an existing grip's location or creates another slice plane at the new location.
- Right clicking a grip toggles the visibility of that slice plane.
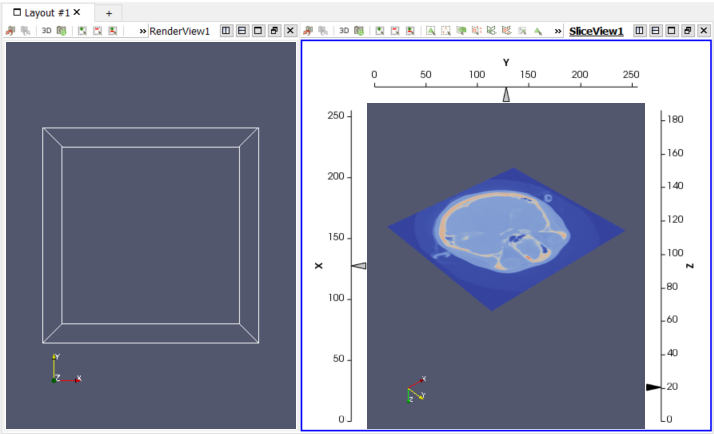
Let's find a good cross section for the Z slice plane such that we can easily see where the skin and bone start and end.
- Hide the X and Y slice planes (right click their grips).
- Drag the Z grip to find a good cross section of the skull. Z = 20 is a good location.

Now we know a good Z value (20) at which to inspect the data to find the densities for skin and bone. You can now close the Slice View.
CVW material development is supported by NSF OAC awards 1854828, 2321040, 2323116 (UT Austin) and 2005506 (Indiana University)