Exploring Data
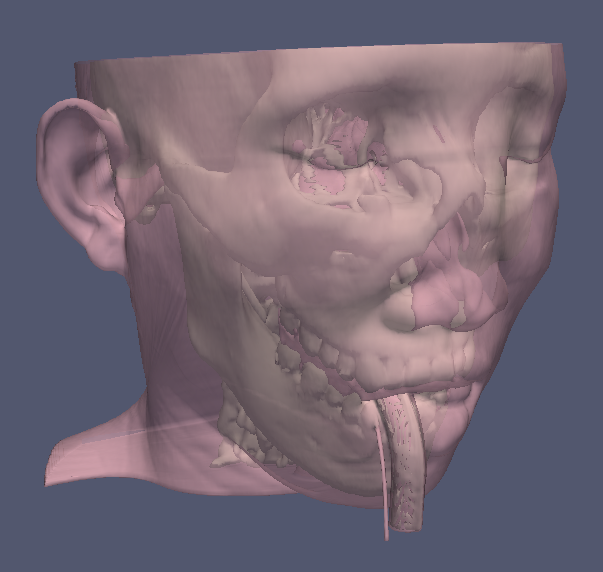
In this section we will introduce some of the ParaView functionalities that can be used to explore a volumetric data set to learn information about its contents. As an example, we will work with scan data from a human head, where each sample point contains a density value. Our goal is to generate isosurfaces that represent the skin and bone of the head.
Isosurfaces can be created where a scalar value (like the density in our data) has a constant value. But how do we know which density values represent skin and bone in this data set? We will first look at a tool for inspecting the contents of different parts of the data set. Then we will apply some statistical filters and viewing techniques to learn more about the density values in the data.
CVW material development is supported by NSF OAC awards 1854828, 2321040, 2323116 (UT Austin) and 2005506 (Indiana University)