Calculator Filter
The Calculator filter allows users to generate new data values for the points or cells of a visualization pipeline. These values are typically the result of computations based on the existing data in the pipeline, which is available to the Calculator filter. In the examples below, we will work with the RectGrid2.vtk data set, which is a rectilinear grid that has both scalar and vector data at each sample point. Let's begin by loading the data and creating an empty Calculator filter:
- Edit→Reset Session to reset ParaView
- File→Open... to open RectGrid2.vtk, then click "Apply"
- Filters→Common→Calculator to add the Calculator filter, then click "Apply"
Using the Calculator Filter
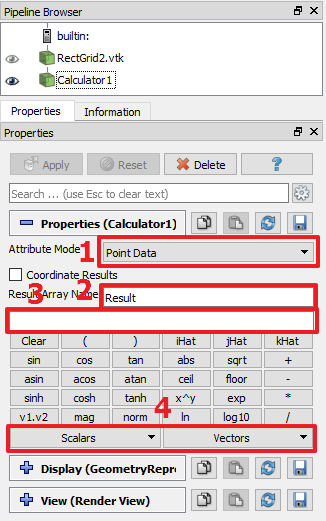
Before entering an expression into the Calculator filter, you will need to decide some things about the data that will be produced by the filter. In the Attribute Mode dropdown (1), select either Point Data or Cell Data to determine if the new values will be associated with each sample point or with each "cell". For grids like the one in this example, a cell is the box formed by the sample points at its corners. For polygonal data, each cell is one polygon.
Next, select a Result Array Name for the new data (by default, it is "Result"). Here, "Array" refers to the fact that a value will be created for each point or cell.
You can now enter the filter's expression (3), either by typing or by clicking the buttons below the text entry. The Scalars and Vectors dropdowns (4) make it easy to select only valid pipeline data that is available to the filter.
In this example, if you have selected "Point Data" as the Attribute Mode, the Vectors dropdown includes not only the "vectors" data from RectGrid2, but also "coords", which represents the spatial location of each sample point.
Similarly, if you were to set the Attribute Mode to "Cell Data", the Vectors and Scalars dropdowns would be empty because RectGrid2's "scalars", "vectors" and "coords" data arrays are associated with sample points, not cells.
Let's assume that we would like to base some later visualization on the square roots
of the "scalars" data values at each sample point.
Enter "sqrt(scalars)" as the Calculator expression and click "Apply".
If your expression contains invalid syntax,
an "Output Messages" dialog will open to display the errors.
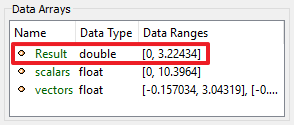
Now select the Information tab of the Properties panel and look at the list of Data Arrays.
The new data array "Result" is included and we can see that its maximum value
is the square root of the "scalars" maximum.
Calculating a Vector
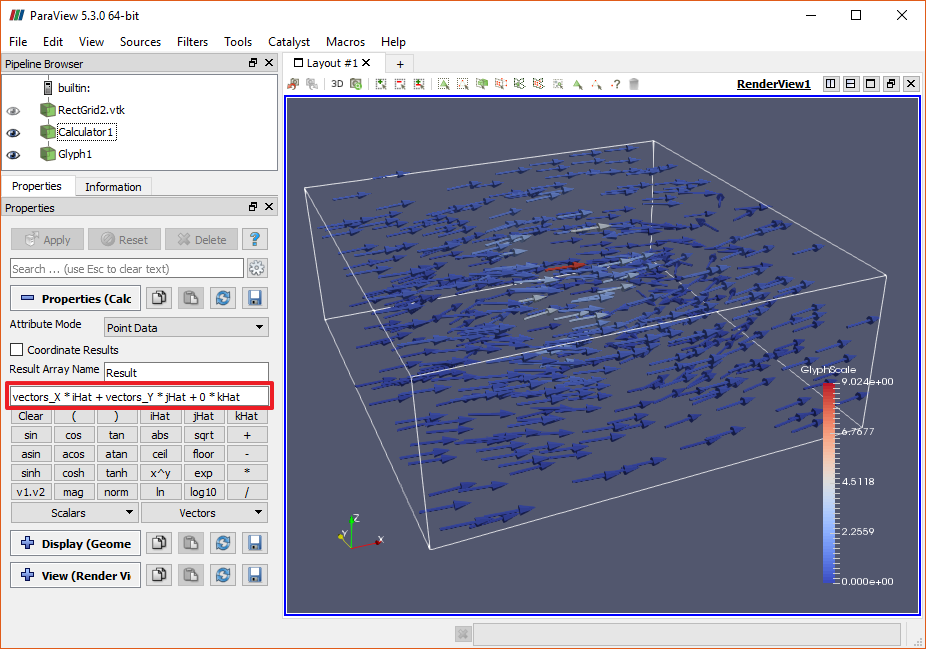
In order to create a calculated data array of vectors you must specify all three elements of the vector. The three variables "iHat", "jHat" and "kHat" are defined to assist in these assignments. Let's say we want to create a new vector that contains the X and Y values of each sample point's existing "vectors" value, but sets the Z values to 0. Our equation would be:
If we return to the Properties tab and apply that equation, we can then add a Glyph filter and set its "Vectors" attribute to the value produced by the Calculator filter (by default, "Result"). If we then set the Glyph's Scale Array to be "No scale array" and set its Maximum Number of Sample Points to 500, then click "Apply", we should see vectors whose Z components are all zero.
Calculating New Geometry Data
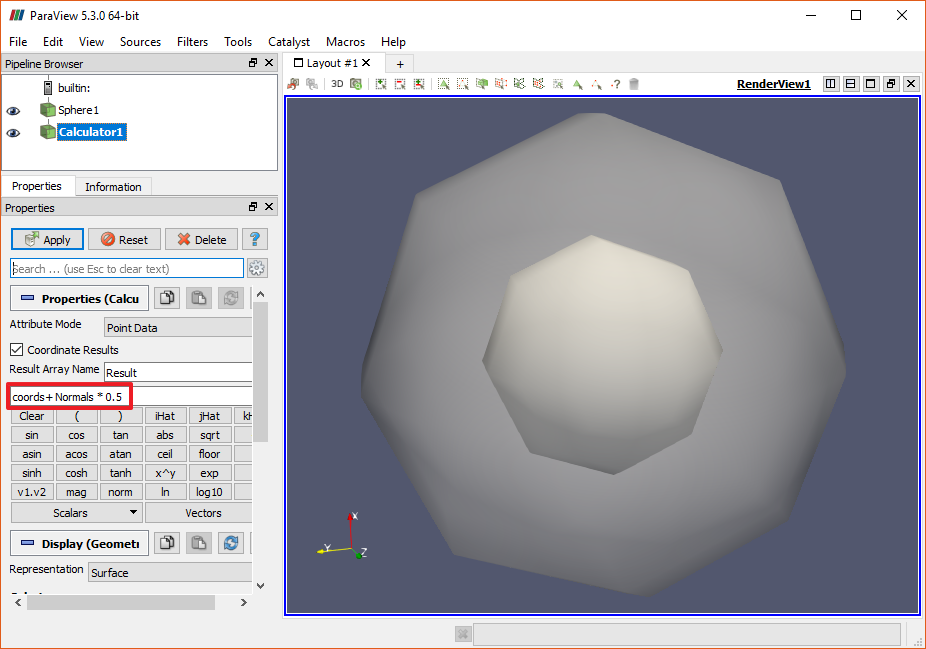
If your visualization pipeline contains polygonal data, the Calculator filter can be used to modify the spatial coordinates, normal vectors and texture coordinates of that data. When a Calculator filter's "Coordinate Results" box is checked, its "Result Array Name" value is ignored and the vector result of the Calculator filter's expression is assigned to the point coordinates. As an example, we create a sphere and use a Calculator filter to add half of each point's normal vector to the point's spatial location, resulting in a larger sphere. The larger sphere is made transparent to show both spheres at once.
- Edit→Reset Session to remove the current pipeline
- Sources→Geometric Shapes→Sphere, then click "Apply"
- Filters→Common→Calculator
- Check "Coordinate Results" box
- Enter "
coords + Normals * 0.5" as the expression, then click "Apply" - In Display properties, set Opacity to 0.5. Make sure the original Sphere is still visible.
If you toggle the "Advanced" properties mode (the "gear" button), the "Result Normals" and "Result TCoords" checkboxes will also be visible. These can be used to assign the results of the expression to the normal vectors and/or texture coordinates of the pipeline's point data.
CVW material development is supported by NSF OAC awards 1854828, 2321040, 2323116 (UT Austin) and 2005506 (Indiana University)