Exercise
Creating a Python Calculator Filter
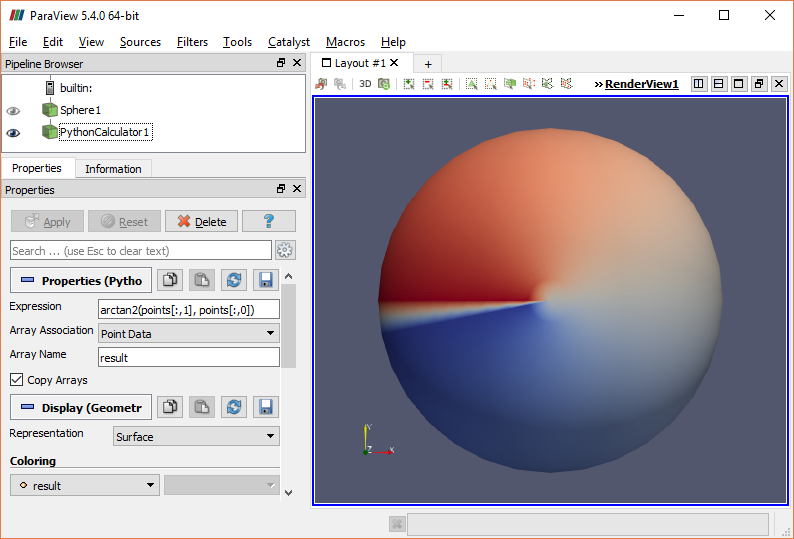
Use the techniques discussed in the Python Calculator section to generate a new data array for a Sphere source.
- Add a Sphere source and increase its Theta and Phi resolutions to 32.
-
Add a Python Calculator and set its Expression to generate a new scalar data array
that wraps from -ϖ to +ϖ around the Z axis of the sphere.
The Python expression for this value passes the X and Y elements
of each data point to the arctangent function:
- Use the new data array to map the color ramp to the sphere. Note that there will be a visible seam where the min and max values are adjacent.
©
|
Cornell University
|
Center for Advanced Computing
|
Copyright Statement
|
Access Statement
CVW material development is supported by NSF OAC awards 1854828, 2321040, 2323116 (UT Austin) and 2005506 (Indiana University)
CVW material development is supported by NSF OAC awards 1854828, 2321040, 2323116 (UT Austin) and 2005506 (Indiana University)