Python Calculator Filter
The Python Calculator filter is a more expressive version of the Calculator filter. It provides the following additional functionality:
- Instead of using a small set of mathematical functions and operators, Python Calculator expressions can use the full power of the NumPy and SciPy Python libraries.
- Some function calls in the filter's expressions accept parameters with more complicated data types than the simple scalars and vectors of the Calculator filter expressions.
- The filter can accept input values from more than one pipeline node.
The ParaView Tutorials include a tutorial for the Python Calculator that includes a comprehensive list of the NumPy and SciPy functions that can be used in expressions.
Python Calculator Expressions
As with the Calculator filter, Python Calculator allows you to specify its Array Association (Point Data or Cell Data) and assign a name to the output Array. It also provides a "Copy Arrays" checkbox that determines whether all of the filter's input data arrays are copied to its outputs. However, when it comes to the expression itself, the Python Calculator is substantially different from the Calculator.
Expressions in the Calculator filter may reference the filter's input data arrays.
A Python Calculator expression can simply use such data array names
when it has a single input,
but must use an alternative syntax when it has multiple inputs.
Each of the nodes that serve as inputs to a Python Calculator
is accessible in expressions using the inputs variable.
The first input is accessed as inputs[0]
and successive inputs use incrementally higher indices.
This syntax returns a "dataset" object.
Dataset objects can be passed as parameters to some NumPy and SciPy functions and are also used to access their constituent geometry and data arrays.
- Each dataset has a
.Pointsmember that accesses its spatial data locations. - The point data arrays of a dataset are accessed with the
.PointDatamember. - The cell data arrays of a dataset are accessed with the
.CellDatamember.
Those last two members return lists of data arrays, where the indices to the list are the names of the arrays. Thus, a data array named "Normals" in the point data collection of a filter's second input would be accessed with:
The Python Calculator differs from the Calculator filter
in the way that vectors are assigned in expressions.
Instead of multiplying scalars against three axis vectors,
the NumPy function hstack() is used to construct a vector.
For scalars x, y and z,
a vector can be constructed with:
Functions With Higher Order Parameter Data
Most of the Calculator filter's expression functions accept scalar values as parameters,
and a few of its operators work with vector data.
In the Python Calculator's expressions,
numerous functions accept whole datasets or selected data arrays as parameters.
In this example, we will use such functions to calculate the areas of the triangles in a sphere
and sum up those areas to approximate the surface area of the sphere.
We first use the area function,
which takes a data set and returns a cell-based data array of areas.
- Edit→Reset Session
- Sources→Sphere, then click "Apply".
- Filters→Alphabetical→Python Calculator to create a Python Calculator filter.
- Enter
area(inputs[0])as the expression. - Set Array Association to "Cell Data", set Array Name to "area", click Apply.
- In the RenderView click "Split Horizontal" and select "SpreadSheet View" for the new view.
- In the new SpreadSheetView, set the "Attribute" dropdown to "Cell Data".
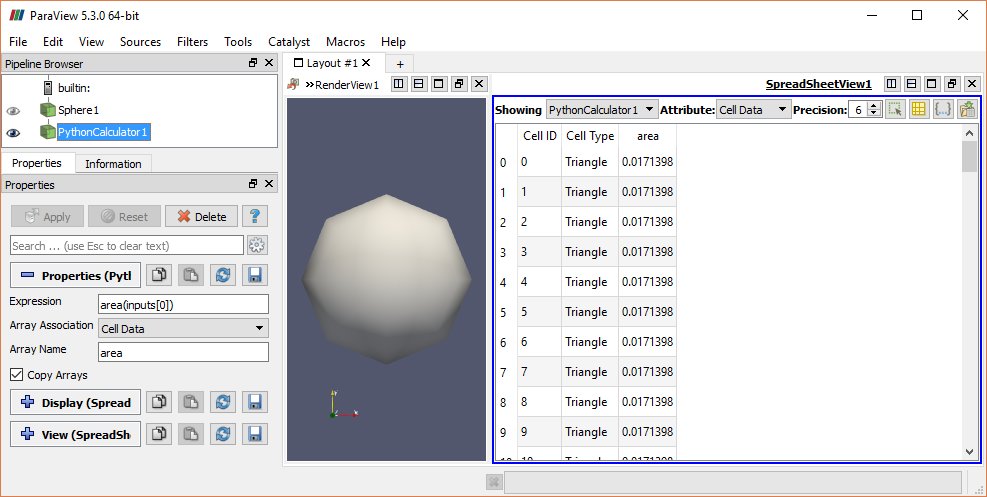
Scroll through the spreadsheet to see that the values in the "area" column
differ over the set of triangles (the triangles are not all the same shape and size).
Let's sum up these areas to approximate the surface area for the whole tesselated sphere.
We will use the sum method, which takes a data array as its parameter
and returns its sum, which is then assigned to each cell.
Change the Python Calculator expression to be sum(area(inputs[0])) and click "Apply".
The area value is now set to 2.90882 for all cells. This sum isn't far from the value of pi, the true surface area of a sphere of radius 0.5. Let's refine the sphere's geometry and see if we can do better. Select the Sphere1 node and in the Properties panel set its "Theta Resolution" and "Phi Resolution" properties to 100, then click "Apply". With the smoother approximation of a sphere, the area values in the table are now 3.14016.
Multiple Inputs
When a Python Calculator has multiple input nodes, its expression can operate simultaneously on data from the different nodes. A Python Calculator can have multiple inputs only if they each have exactly the same topology and geometry so that their data arrays have identical dimensions. If you have run the same simulation multiple times and each run has produced a data set with the same dimensions, a Python Calculator can accept all of those data sets as simultaneous inputs. Note that when a Python Calculator has more than one input, its display geometry is taken from its first input node.
To explore assigning multiple inputs to a Python Calculator, we will use a somewhat contrived example based on a pair of similar images. These images have the same dimensions, and thus have identical data arrays, making them suitable for use as multiple inputs to a Python Calculator. After adding the input data, all of the input nodes must be selected when the Python Calculator filter is added to the visualization pipeline.
- Edit→Reset Session
- File→Open, then select and open both of the files square1.jpg and square2.jpg (from the downloaded data.zip file). Note that selecting the file group "square..jpg" will not work.
- Click Apply in each of the nodes that are created.
- Select the square1.jpg node and then add the square2.jpg node to the selection (On Windows, click while pressing Control. On a Mac, click while pressing Shift.).
- Filters→Alphabetical→Python Calculator to create a calculator that is connected to both inputs.
Notice that multiple linked PythonCalculator nodes are displayed: one child node for each of the inputs, plus one parent node. Changes made to any of these nodes will appear in all of them. Each of the loaded images contains gray scale patterns over white backgrounds. In their own nodes, the images are displayed using the default color ramp, such that the white background (the highest values) maps to the red at the top of the ramp and the gray pattern maps to a range of colors in the middle of the ramp. Let's use the Python Calculator to subtract one image from the other:
- Set the Expression to:
- Set the Array Association to "Point Data" and the Array Name to "result". Click Apply.
- In the Display Properties, set Coloring to "result" and "Magnitude".
- Make sure that the two source image nodes are not visible.
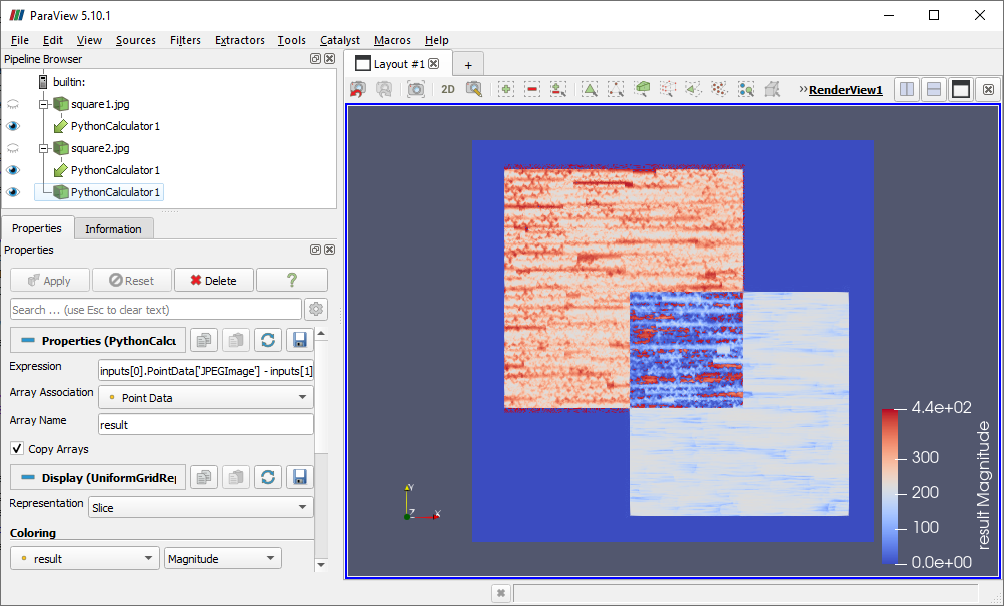
Now that one image's background has been subtracted from the other image, the resulting background color is zero, which maps to blue (the bottom of the color map). The remaining pixel colors represent the difference between the two images, modulo 255 (the maximum value for this type of data).
CVW material development is supported by NSF OAC awards 1854828, 2321040, 2323116 (UT Austin) and 2005506 (Indiana University)