Python View
ParaView allows you to create customized views in which you can display visualization pipeline data in new ways. Writing the Python scripts for these views is somewhat more complicated than writing the scripts for Programmable Sources and Filters, and is only recommended to more advanced users.
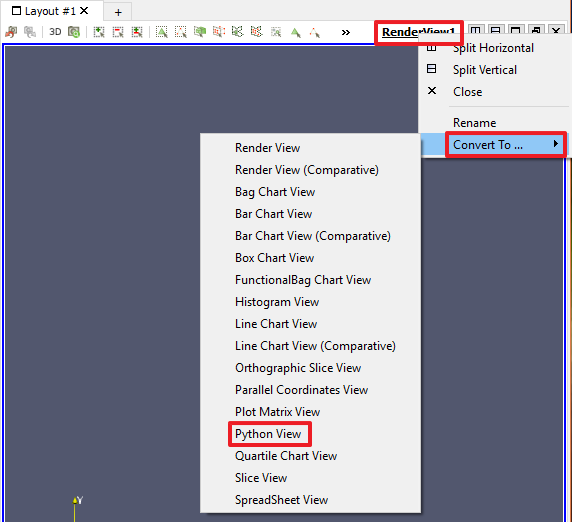
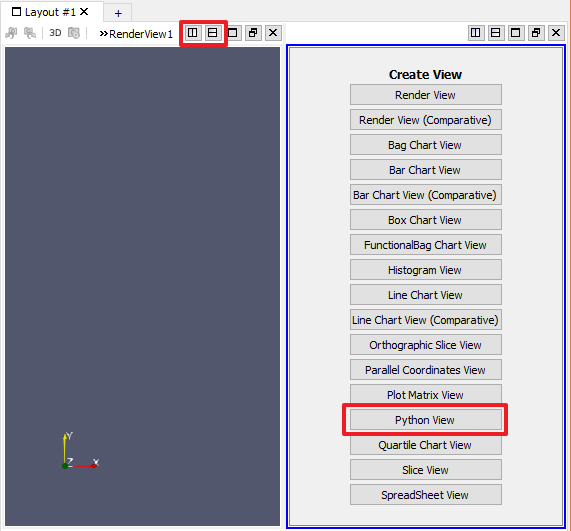
There are two common ways to create a Python View. The first is to right click on the name of an existing view. This raises a context menu in which you must choose the "Convert To..." sub-menu. Then, select the "Python View" item, which converts the view to the new type. The second way is to go to the toolbar of an existing view and click one of the subdivision buttons (horizontal or vertical) to split that view in two. In the new view, click "Python View" to complete the view creation process.


Each Python View is associated with a vtkPythonView instance. When you select a Python View it becomes outlined in blue and the View section of the Properties panel will contain a "Script" text entry box. The text box contains the same script text regardless of the visualization pipeline node selection. Whenever the mouse focus leaves the Script text box, the view will be re-rendered.
The script you enter into the text box must contain two functions,
as described in the Python View section of the ParaView User's Guide.
The setup_data function identifies the data arrays from the visualization pipeline
that will be used when rendering the view.
When ParaView is configured to have a separate data server and client,
this function ensures that the necessary data is copied from the server to the client.
The render function then performs the actual rendering of this data,
returning a vtkImageData
object that has the correct dimensions for the view.
ParaView then displays the image in the view.
External libraries are often used to render data in Python View scripts. The matplotlib library is a popular source of Python rendering functionality. ParaView provides a python_view library containing convenience functions that makes it easier to interface between matplotlib, NumPy and ParaView.
CVW material development is supported by NSF OAC awards 1854828, 2321040, 2323116 (UT Austin) and 2005506 (Indiana University)