Exercise
To complete this exercise on Frontera or Stampede3 you will need:
- A TACC account to log in to either system.
- A computation allocation for Frontera or Stampede3.
If you do not have access to a TACC system, the exercise can be performed on your personal computer by omitting the use of the processor IDs to color the data.
Start ParaView on the TACC system using the Analysis Portal
Follow the steps on a prior page to log in to the system through the TACC Analysis Portal and start a ParaView application and server there.
You will be creating a visualization of the headsq.vti data set,
which can be found in the sample data for this tutorial.
You can upload this file from your local computer to Frontera
using one of the techniques for transferring files,
such as scp.
Note that it is not possible to drag/drop or copy/paste such data files
into the Analysis Portal's VNC display.
Visualize the Head Data Set
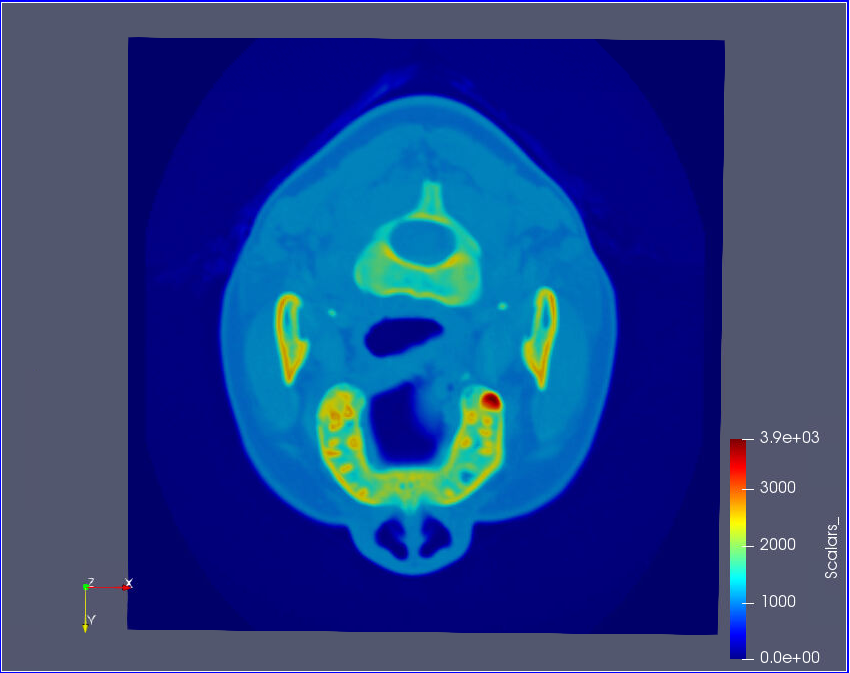
To visualize a cross-section of the data set, do the following:
- Load the
headsq.vtkdata set into ParaView. - Add a Slice filter to the data set and orient it along the Z axis at offset 0.
- Select the "Jet" or "Turbo" color map
- Rotate the camera until the image looks like the one below.

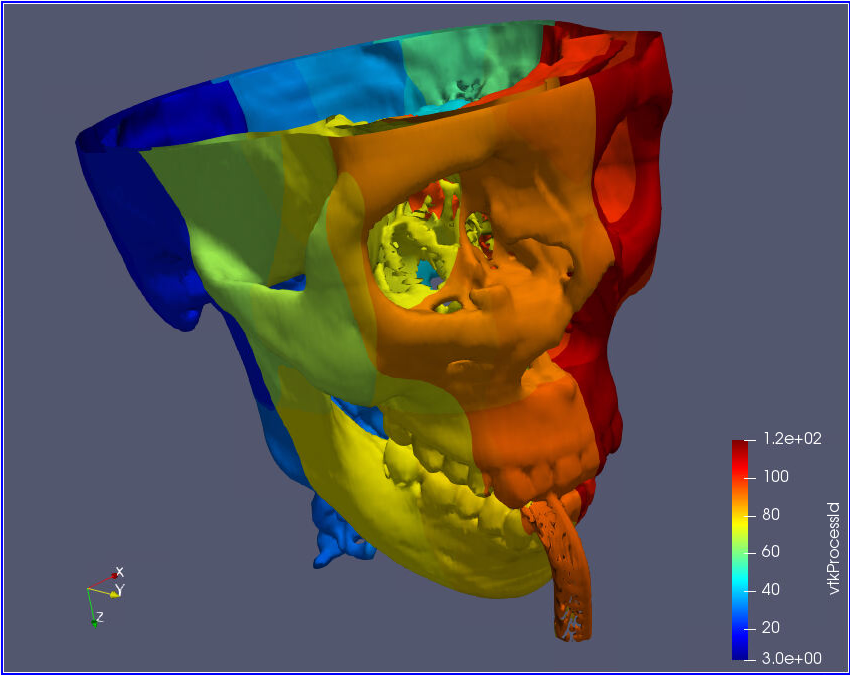
To visualize the bones in the data set, colored by processor ID, do the following:
- Delete the Slice filter.
- Add a Contour filter and set the single Isosurface value to be 1200 (a scalar value that is approximately at the edge of the bone density).
- Use the "Jet" or "Turbo" color map and the vtkProcessId property to color each section of the data based on the processor that worked on it.
- Rotate and zoom the camera until the image looks like the one below.

CVW material development is supported by NSF OAC awards 1854828, 2321040, 2323116 (UT Austin) and 2005506 (Indiana University)