Pipeline Browser
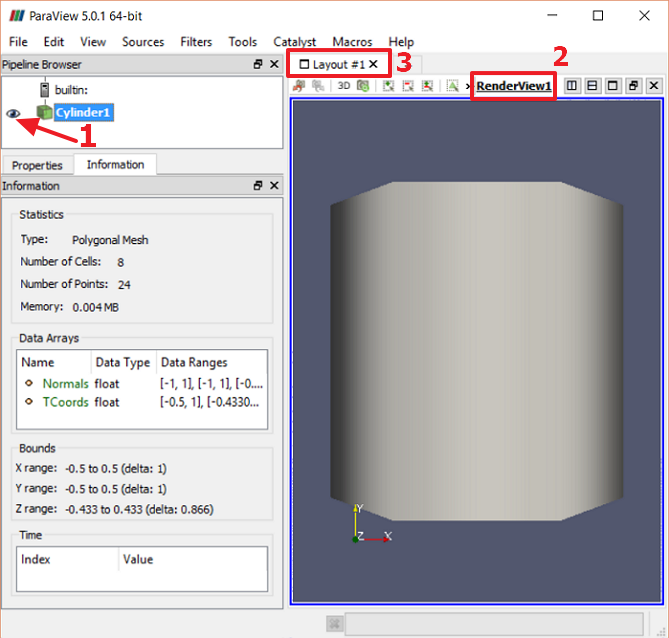
Let's begin exploring ParaView's panels by adding some data to the visualization pipeline. In addition to importing data from external file sources, users can include data from numerous predefined parametric sources. These sources provide simple shapes that can be used to enhance the presentation of data.
To keep this example simple, we will use the predefined cylinder source.
All sources are created using items found under the Sources menu.
Select

When additional sources are added, they will appear in the pipeline browser as children of the top node. The browser's top node displays the name of the server to which ParaView is connected. In this example, the server is the one that is "built in" to the stand-alone application. In later sections we will add filters to source nodes, and they will be positioned as child nodes of those source nodes in the browser tree. Every node that can contribute to the rendered image will have its own visibility toggle.
CVW material development is supported by NSF OAC awards 1854828, 2321040, 2323116 (UT Austin) and 2005506 (Indiana University)