Applying a Filter
One way to view the data in a regular grid is to slice a plane through it. By using the sample values near that plane, ParaView can create a spatially located 2D image that can be displayed. Let's add such a "Slice" filter to our pipeline.
First, rotate the view so the Z axis is up and the X axis is to the right
(use the axis triad in the lower left corner as a guide).
Now, select the RectGrid2.vtk source node in the pipeline browser
and then choose
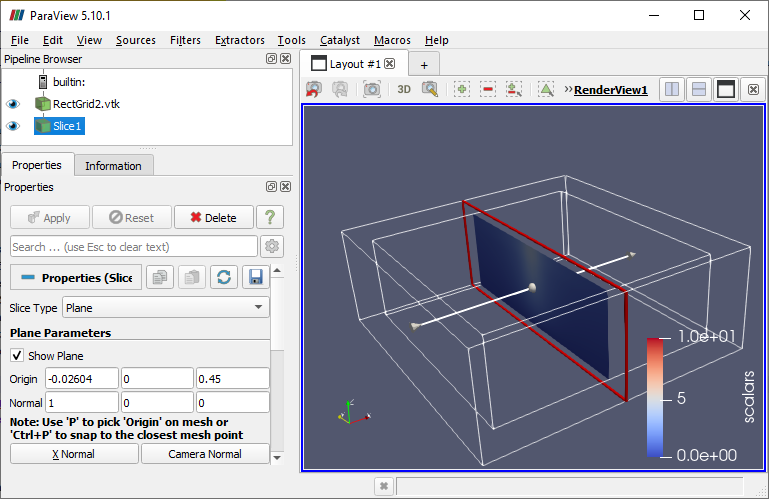
There are now a lot more things being displayed in the Render View. The inner wirefame box is displayed because the source node's visibility is on. The blue rectangular image is displayed because the newly added filter node's visibility is on. The outer wirerame box and the red rectangle are visible because the filter node is selected and the Properties section is expanded.
Remember that the selected node also determines what we see in the Properties section. Select the Pipeline Browser's root node to deselect the currently selected node. Click on a selected node to rename it, which can be helpful when you have a lot of nodes.
With the Slice1 filter node selected we can move the slicing plane around. This can be done using the number entries in the Properties section or with the mouse using the "grips" in the Render View. For the Slice filter, the arrow grip changes the orientation of the slicing plane and the red rectangle can be dragged to reposition the plane along the arrow.
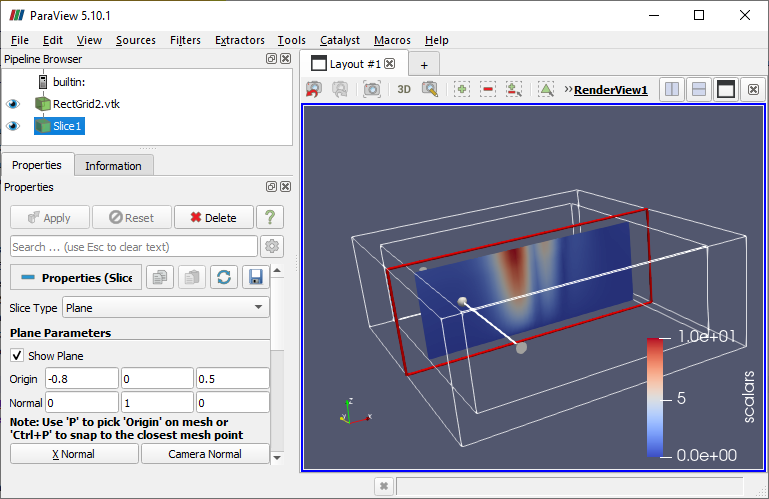
Manipulate the grips and notice that the values in the Properties section are updated and the "Apply" button becomes enabled. Even property changes made via the grips must be committed by clicking "Apply". Using either the grips or number entries, set Normal to approximately (0, 1, 0) and Origin to approximately (-0.8, 0, 0.5), then click "Apply". This rotates the plane 90 degrees and aligns it with an interesting part of the data.
When you opened the
CVW material development is supported by NSF OAC awards 1854828, 2321040, 2323116 (UT Austin) and 2005506 (Indiana University)