Using Isosurfaces
One technique for visualizing surfaces within volume data is to create isosurfaces. As its name suggests, an isosurface passes through all data points that have the same scalar value. Algorithms that construct isosurfaces account for gaps between data points that have the same scalar value and identify separate isosurface regions. We will now explore creating isosurfaces in ParaView.
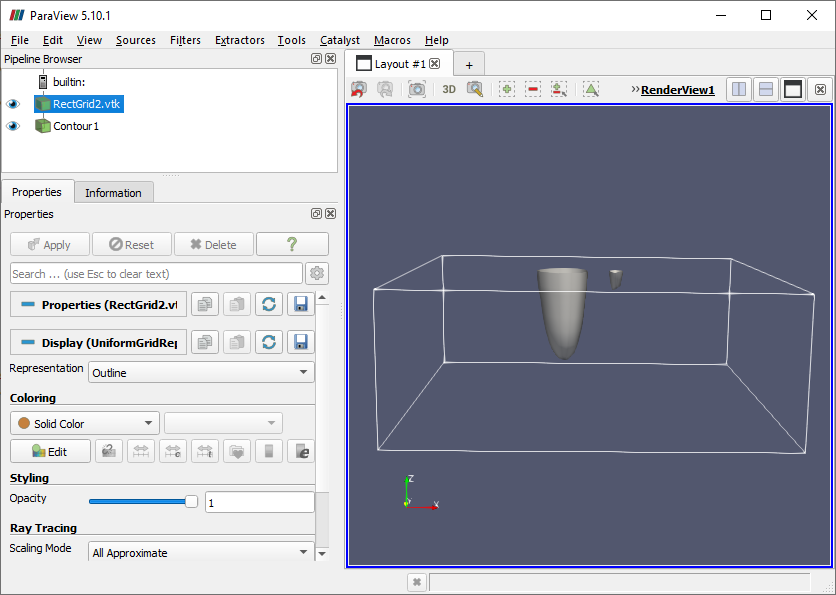
- First, rotate the view so the Z axis is up and the X axis is to the right.
- Select the data source and choose
Filters→Common→Contour . - Click "Apply" in the Properties panel and make the Contour node visible.
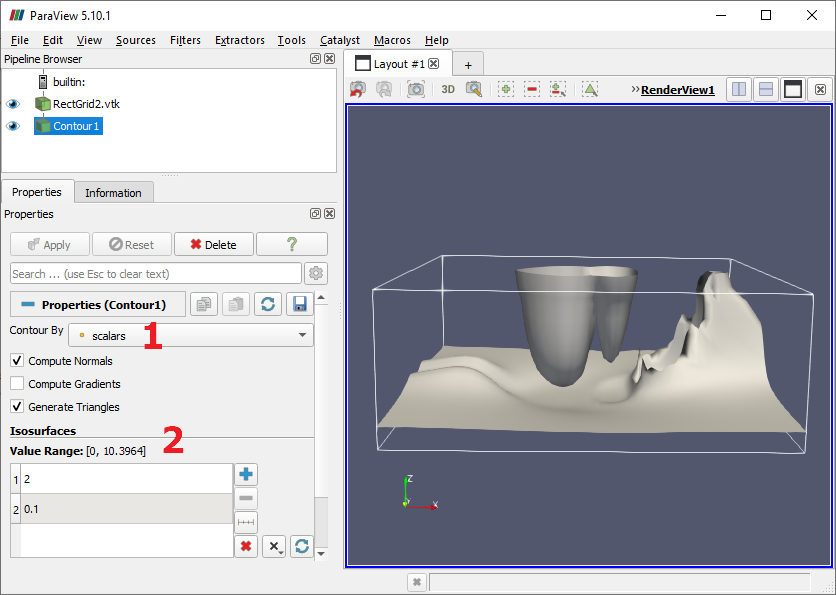
In the Properties panel, the "Contour by" dropdown (1) indicates that the isosurface is being calculated from the "scalars" data at each data point. Each scalar value listed in the "Isosurface" section (2) will produce a separate isosurface. The initial value in a new Contour filter's list will be in the middle of the data range, but that default value might not produce the desired results.
- Edit the initial value to be 2 and click "Apply" to see a different surface.
- Click the "+" button to add another isosurface value and set it to 0.1.
- Click "Apply" to see the modified surfaces.
Contour surfaces can be colored based on data values.
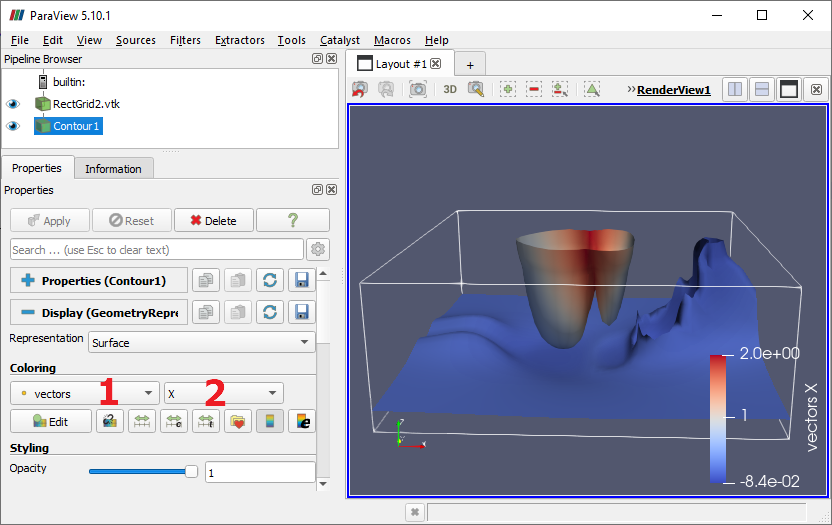
- Scroll down in the properties panel to the Display properties section and expand it if needed.
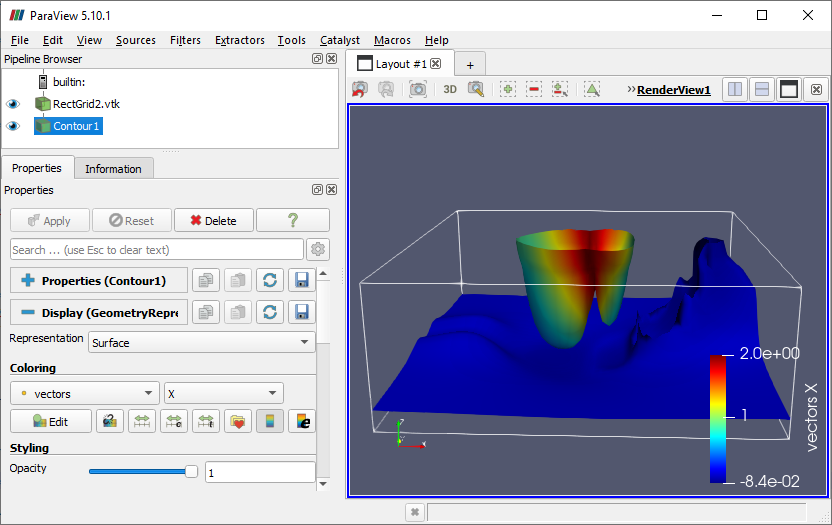
- In the "Coloring" area, select "vectors" in the left dropdown (1) and "X" in the right dropdown (2).
The surface is now colored using the X component of the vector data at each data point.
Using a different color map can make a visualization more informative.
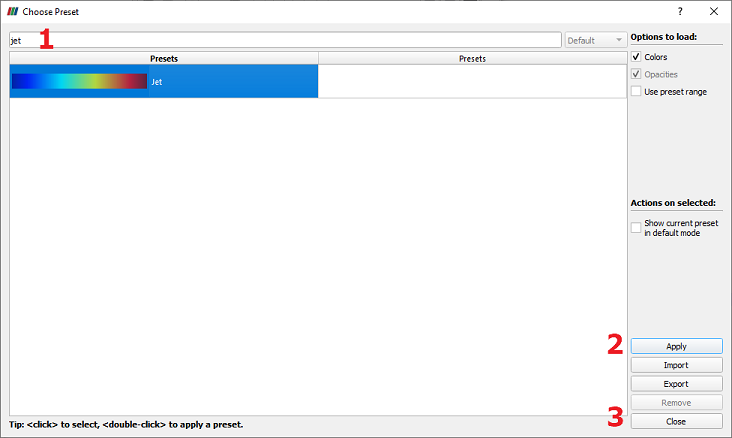
- Click the Edit button to bring up the Color Map Editor and click the "Choose preset" button or drop-down menu.
- If a new dialog comes up, type "Jet" or "Turbo" into the search box (1) and select the color ramp that is found; otherwise, choose "Jet" or "Turbo" from the drop-down menu.
- Click "Apply" (2), then click "Close" (3).
The newly assigned color map is applied to all isosurfaces created by this filter. In order to apply different color maps to separate isosurfaces, you must create a different Contour filter for each isosurface and assign the desired color map to each filter.
CVW material development is supported by NSF OAC awards 1854828, 2321040, 2323116 (UT Austin) and 2005506 (Indiana University)