Demonstrations
The arrow glyphs in the previous section are one technique for visualizing a vector field. In some cases, an even better visualization can be achieved using "stream traces". Stream traces interpolate vectors from nearby sample points to produce a more continuous representation of the flow through the vector field.
Continuing from the previous section:
- Delete the Glyph1 and ExtractSubset1 nodes in the Pipeline Browser (note that the ExtractSubset1 node cannot be deleted until its dependent child node (Glyph1) is deleted).
- Select the data source node and choose
Filters→Common→Stream Tracer . - Hide the data source node and make the new node visible.
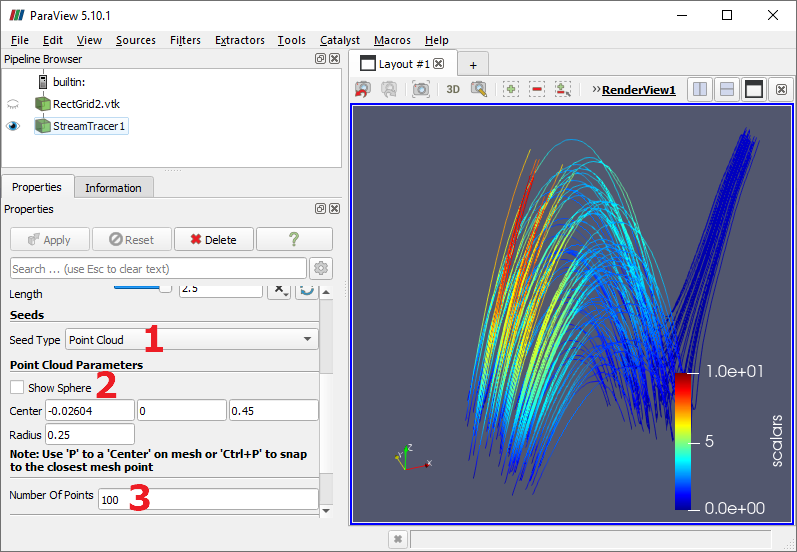
- Set the Seed Type to "Point Cloud" (1) to specify that stream lines should be generated within a radius of a specified point.
- Uncheck "Show Sphere" (2) to hide the seed sphere.
- Set "Number of Points" to 100 (3) and click "Apply" to view the initial stream lines.

By default, the streams are colored using the "scalars" values from the data set. In the Display properties section, expand the "Coloring" dropdown to see the numerous additional coloring options that are derived when the streams are calculated.
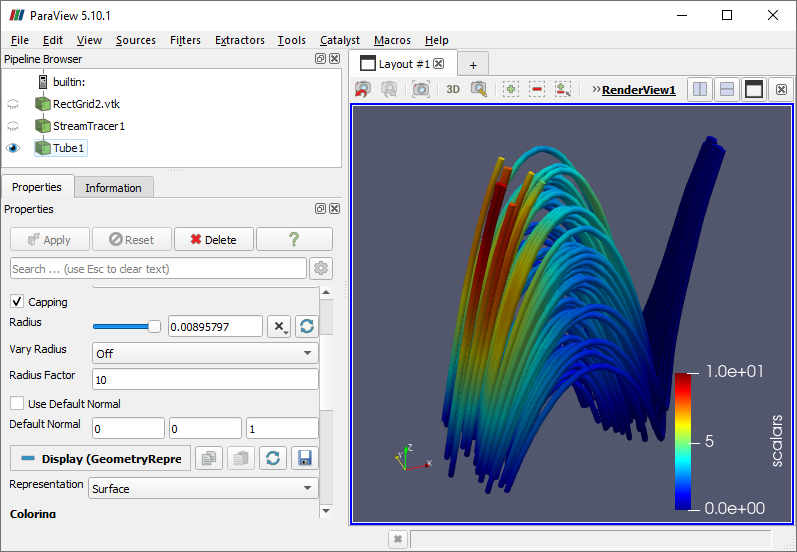
This visualization can be improved by using 3D tubes instead of the lines seen in the previous image.
- Select the StreamTracer1 node and add choose
Filters→Alphabetical→Tube . - Click "Apply", show the Tube filter and hide the StreamTracer filter.
As with the Glyph filters, the Tube filter provides several Display properties for improving the rendered appearance.

CVW material development is supported by NSF OAC awards 1854828, 2321040, 2323116 (UT Austin) and 2005506 (Indiana University)