Regular Grid Example
In this section we will explore some techniques for visualizing volume data as a 3D object.
-
To begin, restart ParaView or select
Edit→Reset Session and change the Display setting for Coloring to be "Solid Color". - Using
File→Open , import the regular grid data set for this tutorial, RectGrid2.vtk. - Click "Apply" in the Properties panel and make the data source node visible.
The data set extents are shown.
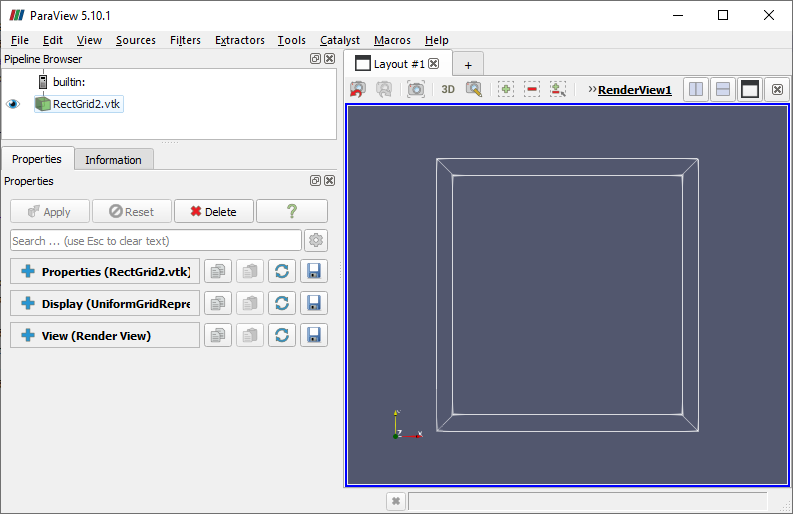
The data source file's ".vtk" ending indicates that it is formatted for the Visualization Toolkit,
a C++ library that provides the underlying functionality of ParaView.
You can see from the
©
|
Cornell University
|
Center for Advanced Computing
|
Copyright Statement
|
Access Statement
CVW material development is supported by NSF OAC awards 1854828, 2321040, 2323116 (UT Austin) and 2005506 (Indiana University)
CVW material development is supported by NSF OAC awards 1854828, 2321040, 2323116 (UT Austin) and 2005506 (Indiana University)